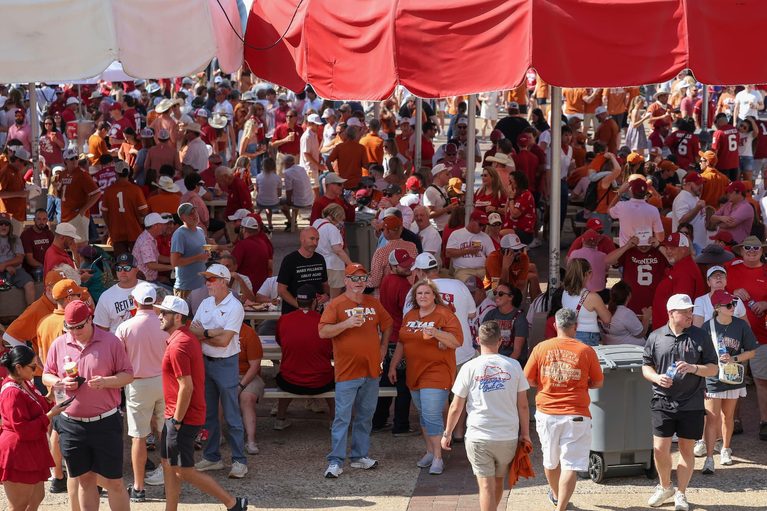

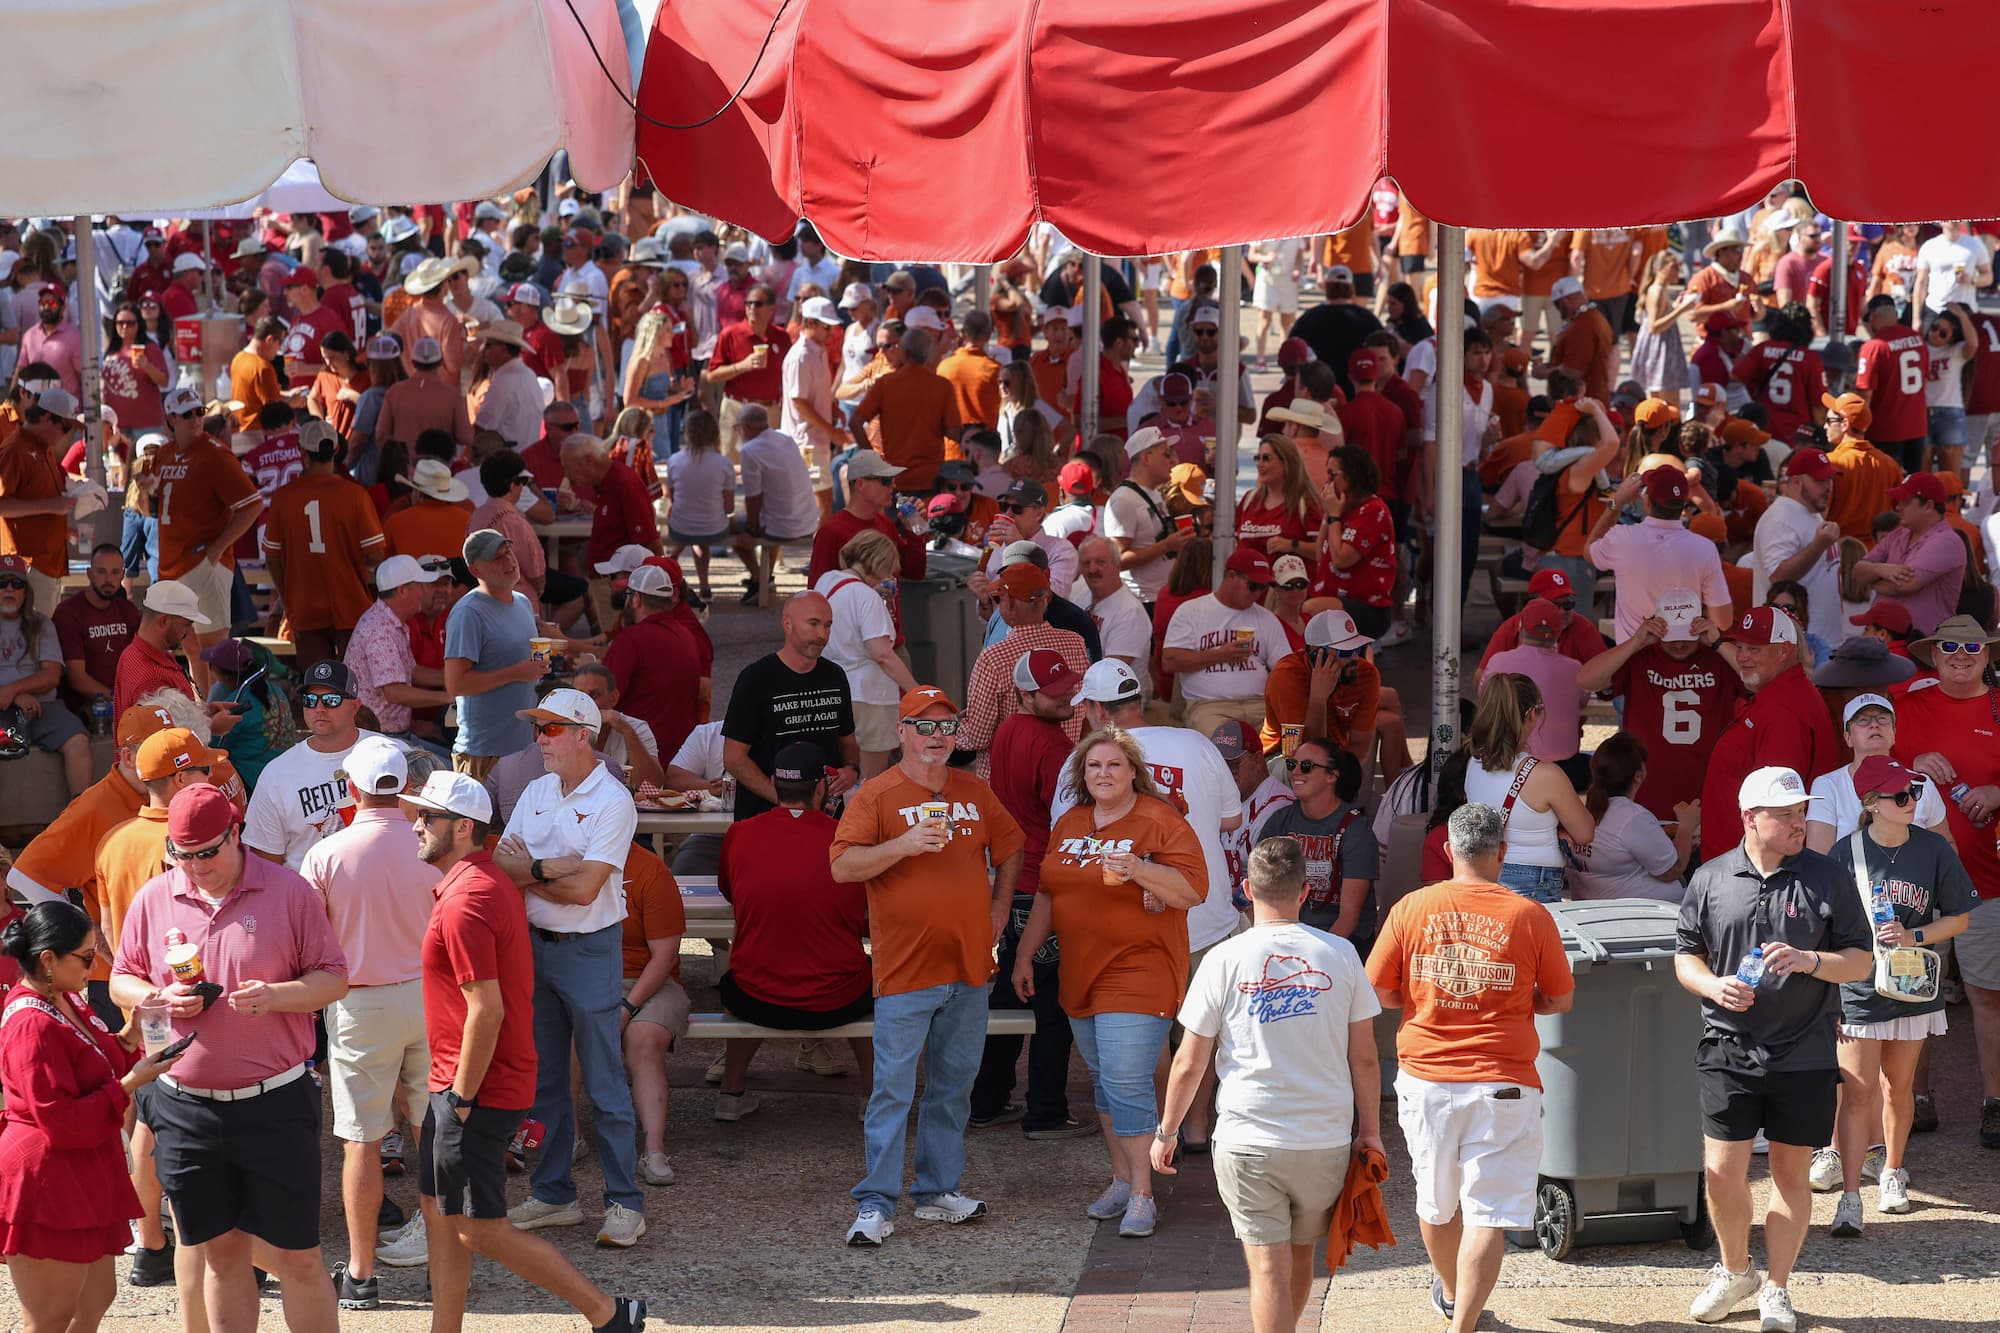
Tailgating: Where Every Game Begins
From a $7.71 propane fill in Lincoln to a $1.69 can of Molson on the slope of Mount Royal, the pre-game ritual looks different everywhere it happens, but the shape of it is the same. Chairs, smoke, a cooler, and four hours you didn’t need to spend but wouldn’t trade.
Texas takes the crown, Tennessee brings the loudest fans, the Midwest quietly wins on value, and Montreal leads the way north of the border. Wherever you’re parked this season, the game starts long before kickoff.
The tailgate has always been the part of game day you control: the food, the company, the hours before anything is decided. These days it also includes the phone in your pocket, and the best betting apps make grabbing a number from the parking lot as easy as firing up the grill.
Methodology
The 2026 Tailgating Index scores locations on three pillars: Affordability (40%), Fan Passion (40%), and Accessibility / Infrastructure (20%). Every metric is normalised to a 0–100 scale using min-max normalisation, with prices inverted so that lower costs produce higher scores. All pricing, search and sentiment data was collected and scored by the Canada Sports Betting research team between 2025 and 2026.
Final Score = (0.40 × Affordability) + (0.40 × Fan Passion) + (0.20 × Accessibility)
United States
Scope: All 50 states. Teams cover 32 NFL franchises and 136 FBS (Division I Football Bowl Subdivision) programs; 43 states host at least one.
- Affordability (40%) — Retail beer case prices (AmericanCraftBeer), regional meat prices (FRED regional series, covering beef, pork, chicken and hot dogs), and residential propane prices (US Energy Information Administration), costed at a 4.7-gallon tank fill. Charcoal was captured at a national retail average of $10.92 per 16 lb bag.
- Fan Passion (40%) — Google Trends search interest for tailgating-related terms by state, August 2024 to September 2025, normalised per 100,000 residents so that small states aren’t penalised for population.
- Accessibility (20%) — Combined count of NFL and FBS programs per state, from official league and NCAA rosters.
Canada
Scope: All nine CFL markets, scored at the Census Metropolitan Area level.
- Affordability (40%) — Local retail beer pricing (provincial liquor retailers and The Beer Store), a meat basket of ground beef, pork rib cuts and wieners priced per kilogram, charcoal and propane tank exchange rates, and average game-day parking pricing from Parkopedia.
- Fan Passion (40%) — Sentiment analysis of fan and visitor reviews across Reddit, Google Maps and TripAdvisor for each stadium, alongside tailgating search interest by market. Winnipeg returned no TripAdvisor data and Vancouver no Google Maps data in the sample window, which depresses both scores.
- Infrastructure (20%) — Parking lot count, total parking spaces and team density within each CMA, measured via Parkopedia against a real 2026 CFL home-game date and time window for each club.
Data collected 2025–2026. Prices in USD for US markets and CAD for Canadian markets; the two are scored separately and not currency-converted.