

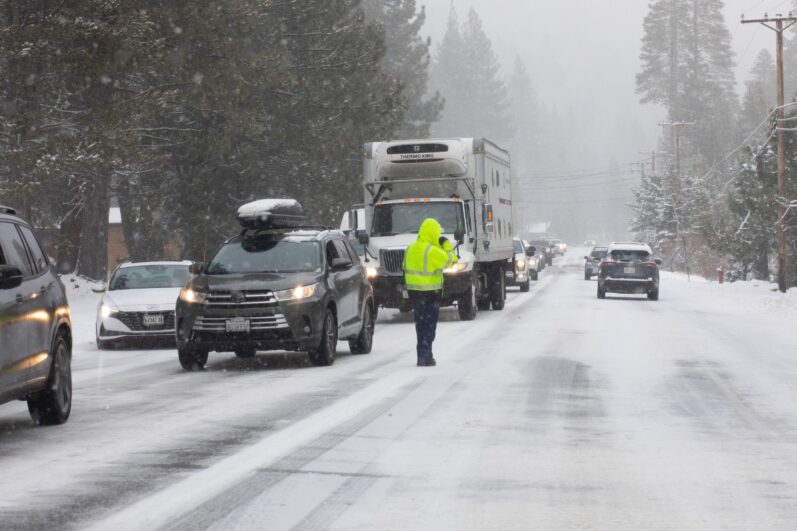
Snowstorms can quickly turn a routine drive into a frustrating delay. While heavy snowfall is often the most obvious factor, road disruption can also be caused by repeated snow days, icy conditions, freeze-thaw cycles, strong wind gusts, and a high chance of precipitation.
Using our Storm Road Delay Index 2026, which focuses on snowstorm-related driving conditions including snowfall, snow days, heaviest daily snowfall, wind gusts, precipitation chance, near-freezing days, and freeze-thaw conditions, we calculated each city’s implied probability of experiencing snowstorm-related road delays this week.
Here’s a closer look at Canadian and U.S. cities most likely to experience snowstorm-related road delays.
Key Findings
Canada Key Findings
- Val-d’Or, QC leads the Canadian ranking at 72.99%, with strong wind gusts, snowfall, and freeze-thaw conditions increasing delay potential.
- Near-freezing conditions are widespread, with Whitehorse, YT, Thompson, MB, and Flin Flon, MB each recording seven near-freezing days.
- Thunder Bay, ON shows a strong mix of weather factors, with an 82% precipitation chance, wind gusts of 70.9 km/h, and four freeze-thaw days.
- Some of Canada’s biggest weather signals sit outside the highest-ranked cities, with Rouyn-Noranda, QC recording the strongest wind gusts at 86.8 km/h, while Churchill, MB has the highest precipitation chance at 96%.
U.S. Key Findings
- Colorado Springs, CO leads the U.S. ranking at 74.52%, with the highest total snowfall and single-day snowfall in the dataset.
- Cheyenne, WY records the strongest wind gusts, reaching 53.6 km/h, alongside four snow days and an implied probability of 64.97%.
- Pueblo, CO shows how disruption is not only about snow, with an 89% precipitation chance and wind gusts of 53.3 km/h, despite only 0.14 cm of total snow.
- Colorado dominates the U.S. ranking, with eight cities appearing in the list, including Colorado Springs, Aspen, Lakewood, Denver, Boulder, Aurora, Pueblo, and Thornton.
Canadian Cities Most at Risk of Snowstorm Road Delays
Canadian Cities Most Likely to Face Snowstorm Road Delays
Rankings are ordered by implied probability, indicating each city’s estimated likelihood of snowstorm-related road delays.

| Rank | City | Implied Probability (%) | Total Snow (cm) | Snow Days (Out of 7) | Heaviest Day (cm) | Max Wind Gust (km/h) | Max Precip Chance (%) | Near-Freezing Days | Freeze-Thaw Days |
|---|---|---|---|---|---|---|---|---|---|
| 1 | Val-d'Or, QC | 72.99% | 2.52 | 1 | 2.52 | 82.8 | 45 | 4 | 4 |
| 2 | Whitehorse, YT | 60.60% | 2.10 | 1 | 2.10 | 43.6 | 41 | 7 | 4 |
| 3 | Thunder Bay, ON | 59.73% | 1.33 | 2 | 0.91 | 70.9 | 82 | 6 | 4 |
| 4 | Timmins, ON | 56.87% | 0.98 | 3 | 0.49 | 67.3 | 72 | 5 | 4 |
| 5 | Saguenay, QC | 51.15% | 1.47 | 2 | 1.26 | 41.4 | 68 | 4 | 2 |
| 6 | Churchill, MB | 46.78% | 1.12 | 1 | 1.12 | 40.3 | 96 | 6 | 4 |
| 7 | Banff, AB | 39.83% | 1.26 | 2 | 0.84 | 17.6 | 33 | 5 | 4 |
| 8 | Fredericton, NB | 35.10% | 0.98 | 1 | 0.98 | 56.9 | 70 | 2 | 0 |
| 9 | Rouyn-Noranda, QC | 34.68% | 0.35 | 1 | 0.35 | 86.8 | 51 | 4 | 4 |
| 10 | North Bay, ON | 26.32% | 0.07 | 1 | 0.07 | 67.0 | 69 | 4 | 3 |
| 11 | Thompson, MB | 23.80% | 0.07 | 1 | 0.07 | 33.8 | 55 | 7 | 5 |
| 12 | Saint John, NB | 21.09% | 0.14 | 1 | 0.14 | 69.5 | 71 | 1 | 0 |
| 13 | Rimouski, QC | 19.51% | 0.21 | 1 | 0.21 | 46.8 | 64 | 3 | 0 |
| 14 | Flin Flon, MB | 19.31% | 0.07 | 1 | 0.07 | 38.9 | 15 | 7 | 4 |
| 15 | Saskatoon, SK | 16.45% | 0.07 | 1 | 0.07 | 53.3 | 9 | 4 | 3 |
| 16 | Calgary, AB | 12.62% | 0.07 | 1 | 0.07 | 42.8 | 29 | 2 | 2 |
| 17 | Whistler, BC | 11.69% | 0.21 | 2 | 0.14 | 25.6 | 13 | 0 | 0 |
Probabilities are based on forecast weather data for the next seven days.
In Canada, the leading delay factors are less about heavy snowfall and more about icy road conditions, strong wind gusts, near-freezing temperatures, and repeated freeze-thaw cycles.
1. Val-d’Or, QC – 72.99%
Val-d’Or has the highest implied probability of snowstorm-related road delays in Canada this week, at 72.99%. While total snowfall is moderate at 2.52 cm, the city faces wind gusts of up to 82.8 km/h, alongside four near-freezing days and four freeze-thaw days.
These conditions can make roads especially unpredictable, as repeated temperature changes increase the chance of slush, refreezing, and icy patches.
2. Whitehorse, YT – 60.60%
Whitehorse ranks second in Canada with a 60.60% implied probability of snowstorm-related delays. The city is forecast to see 2.10 cm of snow, with snow expected on one day of the week.
The bigger concern comes from temperature volatility, with seven near-freezing days and four freeze-thaw days. That combination can create icy road surfaces even when snowfall totals remain relatively low.
3. Thunder Bay, ON – 59.73%
Thunder Bay sits close behind with a 59.73% implied probability of snowstorm-related road delays. The city is expected to see snow across two days, alongside wind gusts reaching 70.9 km/h and an 82% precipitation chance.
With six near-freezing days and four freeze-thaw days, conditions could lead to slick roads and slower traffic, particularly during peak commute periods.
4. Timmins, ON – 56.87%
Timmins ranks fourth in Canada with a 56.87% implied probability of road delays. Although total snow is under 1 cm, the city is forecast to experience snow on three days, with wind gusts reaching 67.3 km/h.
The probability of disruption is also elevated by five near-freezing days and four freeze-thaw days, which can make road surfaces difficult to predict even when snow accumulation is limited.
5. Saguenay, QC – 51.15%
Saguenay rounds out the Canadian ranking with a 51.15% implied probability of delays. The city is forecast to receive 1.47 cm of snow, including a heaviest daily snowfall of 1.26 cm.
With two snow days, a 68% precipitation chance, and four near-freezing days, drivers may face slower conditions, especially if wet roads freeze overnight.
U.S. Cities Most at Risk of Snowstorm Road Delays
The U.S. ranking is led by cities in Colorado and Wyoming, where snowfall totals, repeated snow days, wind gusts, and freeze-thaw conditions combine to increase the chance of snowstorm-related road delays.
U.S. Cities Most Likely to Face Snowstorm Road Delays
Rankings are ordered by implied probability, indicating each city’s estimated likelihood of snowstorm-related road delays.
| Rank | City | Implied Probability (%) | Total Snow (cm) | Snow Days (Out of 7) | Heaviest Day (cm) | Max Wind Gust (km/h) | Max Precip Chance (%) | Near-Freezing Days | Freeze-Thaw Days |
|---|---|---|---|---|---|---|---|---|---|
| 1 | Colorado Springs, CO | 74.52% | 23.38 | 3 | 16.03 | 43.6 | 92 | 2 | 0 |
| 2 | Cheyenne, WY | 64.97% | 11.06 | 4 | 7.63 | 53.6 | 66 | 5 | 1 |
| 3 | Aspen, CO | 64.40% | 14.63 | 3 | 9.87 | 44.3 | 67 | 7 | 3 |
| 4 | Laramie, WY | 59.28% | 7.21 | 4 | 3.64 | 51.1 | 68 | 6 | 4 |
| 5 | Lakewood, CO | 54.28% | 11.76 | 2 | 11.55 | 46.4 | 88 | 2 | 1 |
| 6 | Denver, CO | 36.37% | 6.79 | 2 | 6.72 | 40.3 | 87 | 2 | 0 |
| 7 | Rapid City, SD | 33.69% | 1.89 | 2 | 1.61 | 52.6 | 64 | 4 | 0 |
| 8 | Boulder, CO | 32.83% | 5.04 | 2 | 4.69 | 40.3 | 85 | 2 | 1 |
| 9 | Aurora, CO | 29.82% | 4.34 | 1 | 4.34 | 45.4 | 86 | 2 | 0 |
| 10 | Aurora, IL | 29.82% | 4.34 | 1 | 4.34 | 45.4 | 86 | 2 | 0 |
| 11 | Pueblo, CO | 29.21% | 0.14 | 2 | 0.07 | 53.3 | 89 | 0 | 0 |
| 12 | Augusta, GA | 28.80% | 2.10 | 1 | 2.10 | 50.0 | 88 | 2 | 0 |
| 13 | Casper, WY | 26.41% | 0.91 | 3 | 0.77 | 43.6 | 50 | 3 | 1 |
| 14 | Thornton, CO | 19.67% | 2.87 | 2 | 2.59 | 35.6 | 84 | 0 | 0 |
| 15 | Billings, MT | 13.60% | 0.28 | 1 | 0.28 | 45.0 | 36 | 2 | 2 |
Probabilities are based on forecast weather data for the next seven days.
1. Colorado Springs, CO – 74.52%
Colorado Springs has the highest implied probability of snowstorm-related road delays in the U.S. this week, at 74.52%. The city is forecast to receive 23.38 cm of snow, including a potential 16.03 cm single-day snowfall.
With snow expected across three days and a 92% precipitation chance, road conditions could deteriorate quickly, especially during heavier periods of snowfall.
2. Cheyenne, WY – 64.97%
Cheyenne ranks second with a 64.97% implied probability of snowstorm-related road delays. The city is forecast to see 11.06 cm of snow across four snow days, including a heaviest daily snowfall of 7.63 cm.
Wind gusts of up to 53.6 km/h could make driving conditions more challenging, while repeated snow days increase the chance of packed snow, slush, and icy roads.
3. Aspen, CO – 64.40%
Aspen follows closely with a 64.40% implied probability of snowstorm-related delays. The city is expected to receive 14.63 cm of snow, with a potential 9.87 cm falling on its heaviest day.
Aspen also records seven near-freezing days and three freeze-thaw days, which can make roads particularly hazardous as snow melts and refreezes throughout the week.
4. Laramie, WY – 59.28%
Laramie ranks fourth with a 59.28% implied probability of snowstorm-related road delays. The city is forecast to receive 7.21 cm of snow over four snow days, with wind gusts reaching 51.1 km/h.
The combination of frequent snowfall, near-freezing temperatures, and four freeze-thaw days raises the chance of icy roads and slower travel times.
5. Lakewood, CO – 54.28%
Lakewood rounds out the U.S. ranking with a 54.28% implied probability of delays. The city is forecast to receive 11.76 cm of snow, most of which could fall on a single heavy day, with a maximum daily snowfall of 11.55 cm.
A high 88% precipitation chance means drivers could face difficult road conditions, particularly if heavier snowfall overlaps with commute times.
Be Prepared for Snowstorm-Related Road Conditions
Drivers in the highest-ranked cities should prepare for moderate to severe travel disruption this week. Even when snowfall totals are not extreme, a mix of precipitation, strong winds, near-freezing temperatures, and freeze-thaw cycles can make snowstorm-related road conditions unpredictable.
What drivers can do to reduce snowstorm-related travel disruption:
- Check local forecasts daily for updates on snow, ice, wind, and precipitation.
- Plan extra travel time during peak hours, especially in cities such as Val-d’Or, Colorado Springs, Whitehorse, and Cheyenne.
- Watch for icy patches after freeze-thaw conditions, particularly early in the morning and late at night.
- Use alternate routes where possible and avoid roads known for congestion or accident delays.
- Keep seasonal essentials in the vehicle, including an ice scraper, warm clothing, water, and a phone charger.
Methodology
The Storm Road Delay Index 2026 evaluates cities across Canada and the U.S. to estimate the likelihood of snowstorm-related road delays over a seven-day forecast period.
The index uses forecast data from Open-Meteo and combines the following metrics:
- Total Snowfall: Total forecast snowfall over seven days.
- Snow Days: Number of days with forecast snowfall.
- Heaviest Daily Snowfall: The highest single-day snowfall total during the forecast period.
- Maximum Wind Gust: The strongest forecast wind gust across the week.
- Maximum Precipitation Chance: The highest daily probability of precipitation.
- Near-Freezing Days: Number of days where temperatures are close to freezing, increasing the chance of icy or slushy roads.
- Freeze-Thaw Days: Number of days where temperatures move above and below freezing, increasing the likelihood of melting and refreezing on road surfaces.
Each variable was normalized and combined to create an implied probability of road delays for each city. Higher percentages indicate a greater likelihood of snowstorm-related travel disruption during the seven-day forecast period.
Cities are ranked separately for Canada and the U.S. based on their final implied probability.
This method allows drivers to compare relative snowstorm-related travel disruption potential across cities, accounting not only for snowfall, but also for the conditions that make roads more difficult to navigate, including wind, precipitation, near-freezing temperatures, and freeze-thaw cycles.