

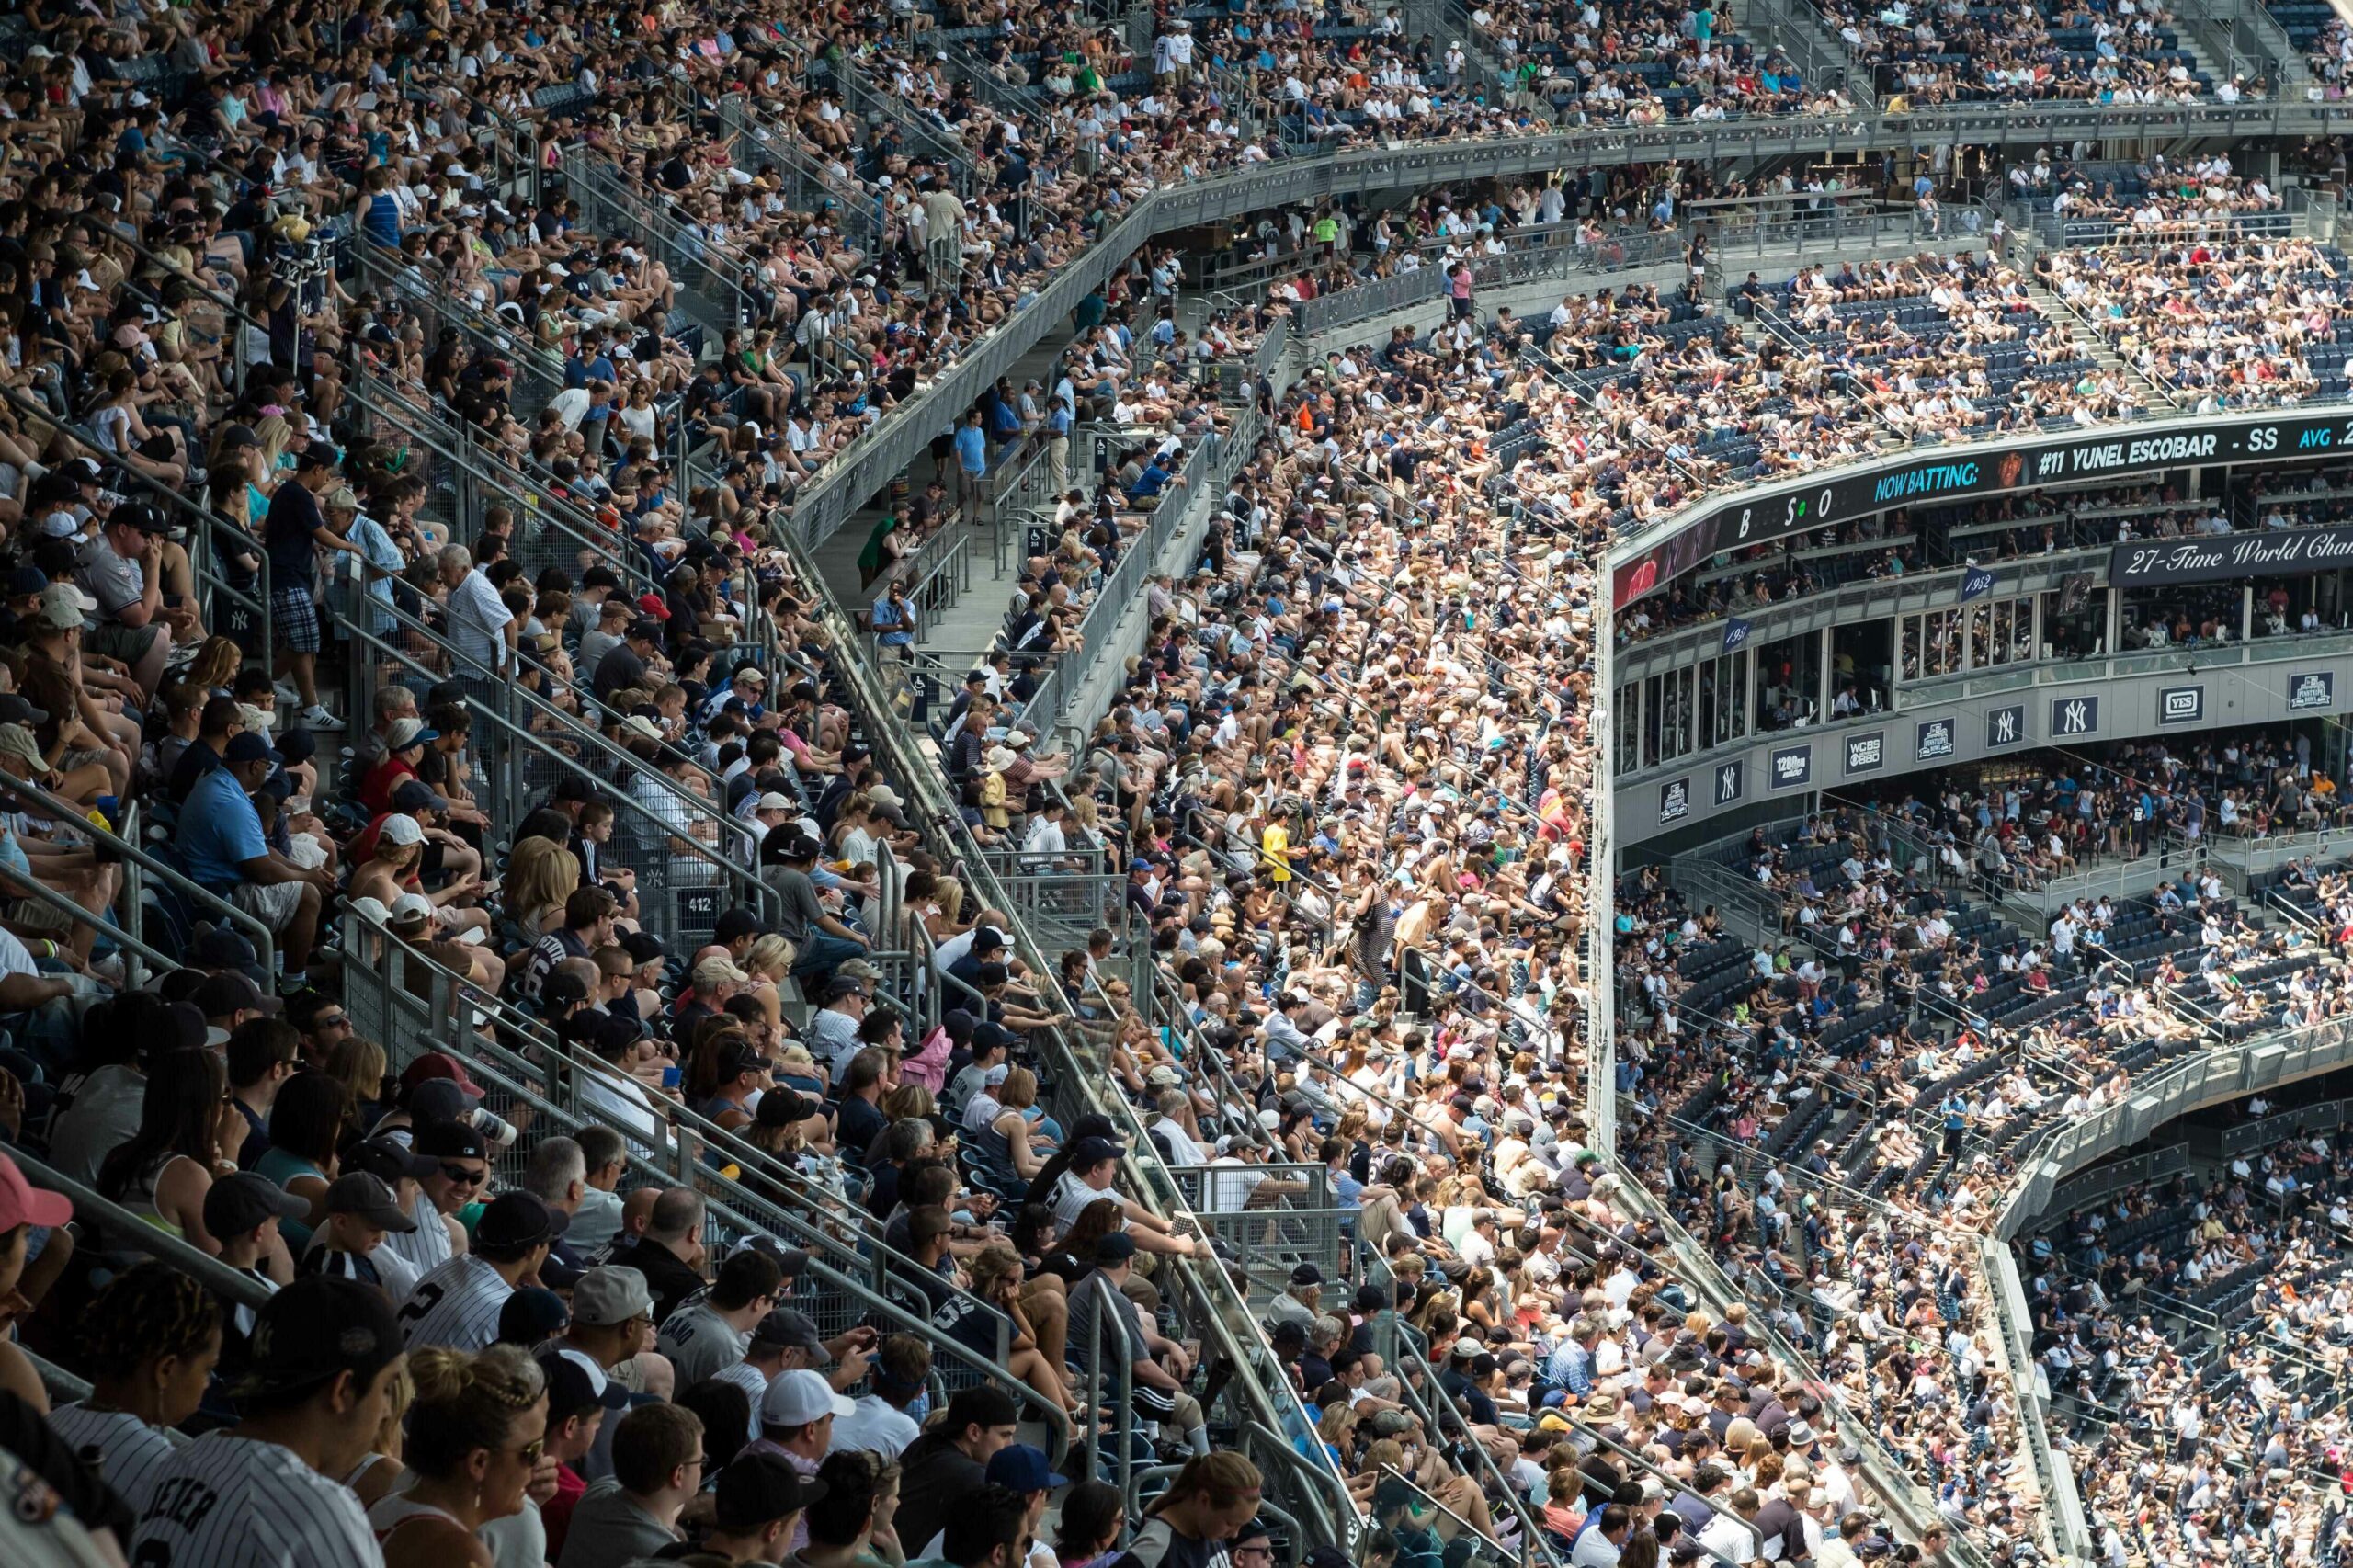
Source: Alamy/James Leynse
Game day has a temperature in the MLB. Some MLB fans spend three hours baking in direct summer sun. Others barely break a sweat thanks to air-conditioned domes and cool coastal weather. How much you sweat depends on where you’re sitting when the first pitch is thrown.
Some fanbases bake for three hours straight, sitting in full sun and thick summer humidity with no roof and nowhere to hide. Others watch from climate-controlled comfort or cool coastal parks where a light jacket isn’t a bad idea, even in July.
To find the sweatiest MLB fans, CanadaSportsBetting.ca blended fan exposure to the elements, how hot it actually gets in the seats, and how long fans are stuck in them. This produced a list of the absolute sweatiest MLB fans.
Key Findings
- The New York Yankees have baseball’s sweatiest fans- thanks to open-air seats, humid summers, and MLB’s longest games at 168 minutes.
- Baseball’s hottest cities aren’t its sweatiest seats: Phoenix hits 31.6°C, yet air conditioning keeps Chase Field fans cool.
- The A’s swelter at Sutter Health Park, with Sacramento game-day highs of 30.8°C and no roof in sight.
- Sun Belt open-air parks bake their fans: The Braves, Cardinals, Reds, and Nationals all rank near the top.
- The Giants have baseball’s coolest seats by a mile, thanks to Oracle Park’s league-low 15.3°C average.
- Long games heat things up: the Yankees and Mets rise on MLB’s longest games, while the Royals’ league-shortest 155 minutes keep fans cool.
- The Blue Jays prove climate control beats climate: despite Toronto being one of the coolest markets in the league, Rogers Centre’s retractable roof and AC keep fans comfortable, landing them well below the hot open-air parks.
The Sweatiest MLB Fans
| Rank | Team | Stadium | Sweat Index (0-100) | Avg. Temp (°C) | Avg. High Temp (°C) | Avg. Game Length (Min) |
|---|---|---|---|---|---|---|
| 1 | Yankees | Yankee Stadium | 84.2 | 20.4 | 25.2 | 168.2 |
| 2 | Orioles | Camden Yards | 81 | 21.7 | 26.6 | 164.6 |
| 3 | Dodgers | Dodger Stadium | 79.1 | 20.2 | 27.4 | 164.5 |
| 4 | A’s | Sutter Health Park | 78.9 | 21.8 | 30.8 | 159.9 |
| 5 | Mets | Citi Field | 77.3 | 20.2 | 24.9 | 166 |
You don’t have to sweat it out in the bleachers to have a stake in the game. The top MLB betting sites and best betting apps let you track the odds and standings from your couch, starting with the Blue Jays at +725 to reach the playoffs.
1. New York Yankees — Yankee Stadium
Sweat Index: 84.2
The Yankees win on the least glamorous combination in baseball: a fully open-air park in a hot, humid summer city, and the longest average games in the league at over 168 minutes. There’s no roof to close and no AC to duck into — just sun, East Coast humidity, and more time in your seat than any other fanbase endures. That’s the sweatiest ticket in MLB.
2. Baltimore Orioles — Camden Yards
Sweat Index: 81.0
Camden Yards pairs some of the hottest game-day conditions among open-air parks (a 22°C mean, near-27°C highs) with long games and full exposure to the Mid-Atlantic summer. Beautiful ballpark — sweaty seats.
3. Los Angeles Dodgers — Dodger Stadium
Sweat Index: 79.1
Day games at Dodger Stadium can be brutal: an open bowl, strong Southern California sun with highs above 27°C, and long games that keep fans in it. The evenings cool off, but the afternoon exposure is real.
4. Athletics — Sutter Health Park
Sweat Index: 78.9
The A’s temporary home in Sacramento is a minor-league park with major-league sun. Game-day highs push 31°C, among the hottest in the league, with no roof, minimal shade, and full exposure. Fans here feel more raw heat than almost anywhere in baseball; only the shorter games keep them out of the top spot.
5. New York Mets — Citi Field
Sweat Index: 77.3
Same humid New York summers as their crosstown rivals, in another open-air park, with the second-longest games in MLB. Citi Field fans sit and simmer.
The Cool End of the League
Two very different kinds of parks land at the bottom: genuinely cool-climate open-air stadiums, and the air-conditioned domes that shield fans from their own hot cities.
- San Francisco Giants (30.1) — Oracle Park is the coolest, driest experience in baseball. Bayside wind and the lowest temperatures in the league mean fans reach for a jacket, not a towel.
- Tampa Bay Rays (37.7) — Tropicana Field is a fixed dome with full climate control. Whatever the Florida weather is doing outside, fans inside stay comfortable.
- Milwaukee Brewers (39.3) — American Family Field’s retractable roof and AC keep a mild Milwaukee climate firmly comfortable.
- Miami Marlins (40.0) — loanDepot Park sits in one of the hottest, most humid markets in America, and its fans barely feel it. The roof stays closed and the AC stays on.
- Seattle Mariners (41.0) — Cool Pacific Northwest climate plus a roof that shelters fans from what little heat there is.
Four of the five “coolest” experiences are either genuinely chilly (San Francisco) or parks capable of enclosing fans (Tampa Bay, Miami, Milwaukee, Seattle). The buildings are doing exactly what they were designed to do.
Game Day Has a Temperature
Sweat isn’t just about how hot the city is. It’s also about how much of that heat actually reaches you, and how long you sit in it. An open-air park in a humid summer market with a three-hour game (Yankee Stadium) will soak you. A climate-controlled dome in the desert (Chase Field) will keep you comfortable while it’s 38°C outside. The sweatiest fans aren’t the ones in the hottest cities. They’re the ones with nowhere to hide from the elements.
Methodology
We ranked all 30 MLB teams by how sweaty the game-day experience is for fans in the seats, combining three factors into a single 0–100 Sweat Index. The central design choice: measure heat as fans actually feel it, which means accounting for air conditioning.
1. Fan Exposure to the Elements
Eight MLB parks have roofs and full climate control (Chase Field, Daikin Park, Globe Life Field, loanDepot Park, Rogers Centre, American Family Field, T-Mobile Park, and the fixed-dome Tropicana Field). When these roofs are closed, the buildings are air-conditioned to a comfortable temperature, so their fans are largely shielded from outdoor heat. These parks receive a low exposure score. Open-air parks, where fans sit fully in the sun and weather, receive a high exposure score scaled up by local heat and sun load.
2. Heat Load
For open-air parks, we used a sun- and peak-load-weighted blend of 2025 game-day mean and high temperatures (Open-Meteo historical weather). For climate-controlled parks, we modeled the felt temperature as the controlled indoor band (roughly 22–24°C), always kept below any genuinely warm open-air day, because that’s what fans in those parks actually experience.
3. Game Length
Longer games mean longer exposure. Using Retrosheet game logs restricted to 2023–2025 (the pitch-clock era, which cut about 25 minutes off the average game), we took each team’s average game duration across all games, home and away, excluding All-Star games.
Index construction: Each factor was normalized with min–max scaling to a 0–100 sub-index, then combined with equal weight (⅓ each) and ranked in descending order.
Limitations. Game length is applied uniformly, even though time in an air-conditioned park is far more comfortable than time in the sun — so if anything, the domes’ ratings are still generous. Indoor felt temperature is modeled as a fixed comfort band rather than measured concourse readings. And the Athletics’ and Rays’ 2025 home situations were unusual; we rated each on the park in the underlying dataset.
You can see the full data here.
Full Rankings: Sweatiest to Coolest
| Rank | Team | Stadium | Sweat Index (0-100) | Avg. Temp (°C) | Avg. High Temp (°C) | Avg. Game Length (Min) |
|---|---|---|---|---|---|---|
| 1 | Yankees | Yankee Stadium | 84.2 | 20.4 | 25.2 | 168.2 |
| 2 | Orioles | Camden Yards | 81 | 21.7 | 26.6 | 164.6 |
| 3 | Dodgers | Dodger Stadium | 79.1 | 20.2 | 27.4 | 164.5 |
| 4 | A’s | Sutter Health Park | 78.9 | 21.8 | 30.8 | 159.9 |
| 5 | Mets | Citi Field | 77.3 | 20.2 | 24.9 | 166 |
| 6 | Braves | Truist Park | 72.9 | 22.7 | 27.9 | 159.3 |
| 7 | Phillies | Citizens Bank Park | 71.9 | 20.6 | 25.5 | 163 |
| 8 | Angels | Angel Stadium | 71.3 | 20.5 | 27 | 161.5 |
| 9 | Cardinals | Busch Stadium | 71 | 22.1 | 26.7 | 160.2 |
| 10 | Reds | Great American Ball Park | 68.2 | 21.1 | 26.1 | 160.6 |
| 11 | Nationals | Nationals Park | 61.9 | 20.8 | 25.5 | 158.8 |
| 12 | Padres | Petco Park | 61.7 | 18.7 | 22.3 | 163.5 |
| 13 | Rockies | Coors Field | 59.6 | 18.8 | 26.5 | 158.8 |
| 14 | Red Sox | Fenway Park | 57.9 | 17.3 | 21.8 | 163.6 |
| 15 | Twins | Target Field | 56.3 | 18.7 | 23.6 | 160.2 |
| 16 | Royals | Kauffman Stadium | 55.7 | 21.3 | 26.4 | 155.1 |
| 17 | Pirates | PNC Park | 55 | 19.1 | 24.4 | 158.6 |
| 18 | D-backs | Chase Field | 53.2 | 31.6 | 37.6 | 164.4 |
| 19 | White Sox | Rate Field | 49.7 | 18.4 | 22.7 | 158.7 |
| 20 | Tigers | Comerica Park | 48.4 | 18.6 | 23.3 | 157.5 |
| 21 | Cubs | Wrigley Field | 48.4 | 17.8 | 21.4 | 159.8 |
| 22 | Astros | Daikin Park | 48.1 | 26.3 | 30.8 | 162.4 |
| 23 | Blue Jays | Rogers Centre | 46.4 | 16.5 | 20.6 | 164.2 |
| 24 | Rangers | Globe Life Field | 43.6 | 25.9 | 30.8 | 160.6 |
| 25 | Guardians | Progressive Field | 43.1 | 17.9 | 20.5 | 158.4 |
| 26 | Mariners | T-Mobile Park | 41 | 16 | 20.9 | 162.1 |
| 27 | Marlins | loanDepot Park | 40 | 27 | 30.1 | 159.2 |
| 28 | Brewers | American Family Field | 39.3 | 16.7 | 21.2 | 161.4 |
| 29 | Rays | Tropicana Field | 37.7 | 26.5 | 30.4 | 158.3 |
| 30 | Giants | Oracle Park | 30.1 | 15.3 | 18.8 | 157.2 |