Super Bowl Safety Index 2026: The Safest and Riskiest NFL Cities for Game-Day Celebrations
A comparative safety lens on game-day celebration environments across NFL metros, plus a brief Canadian context read.
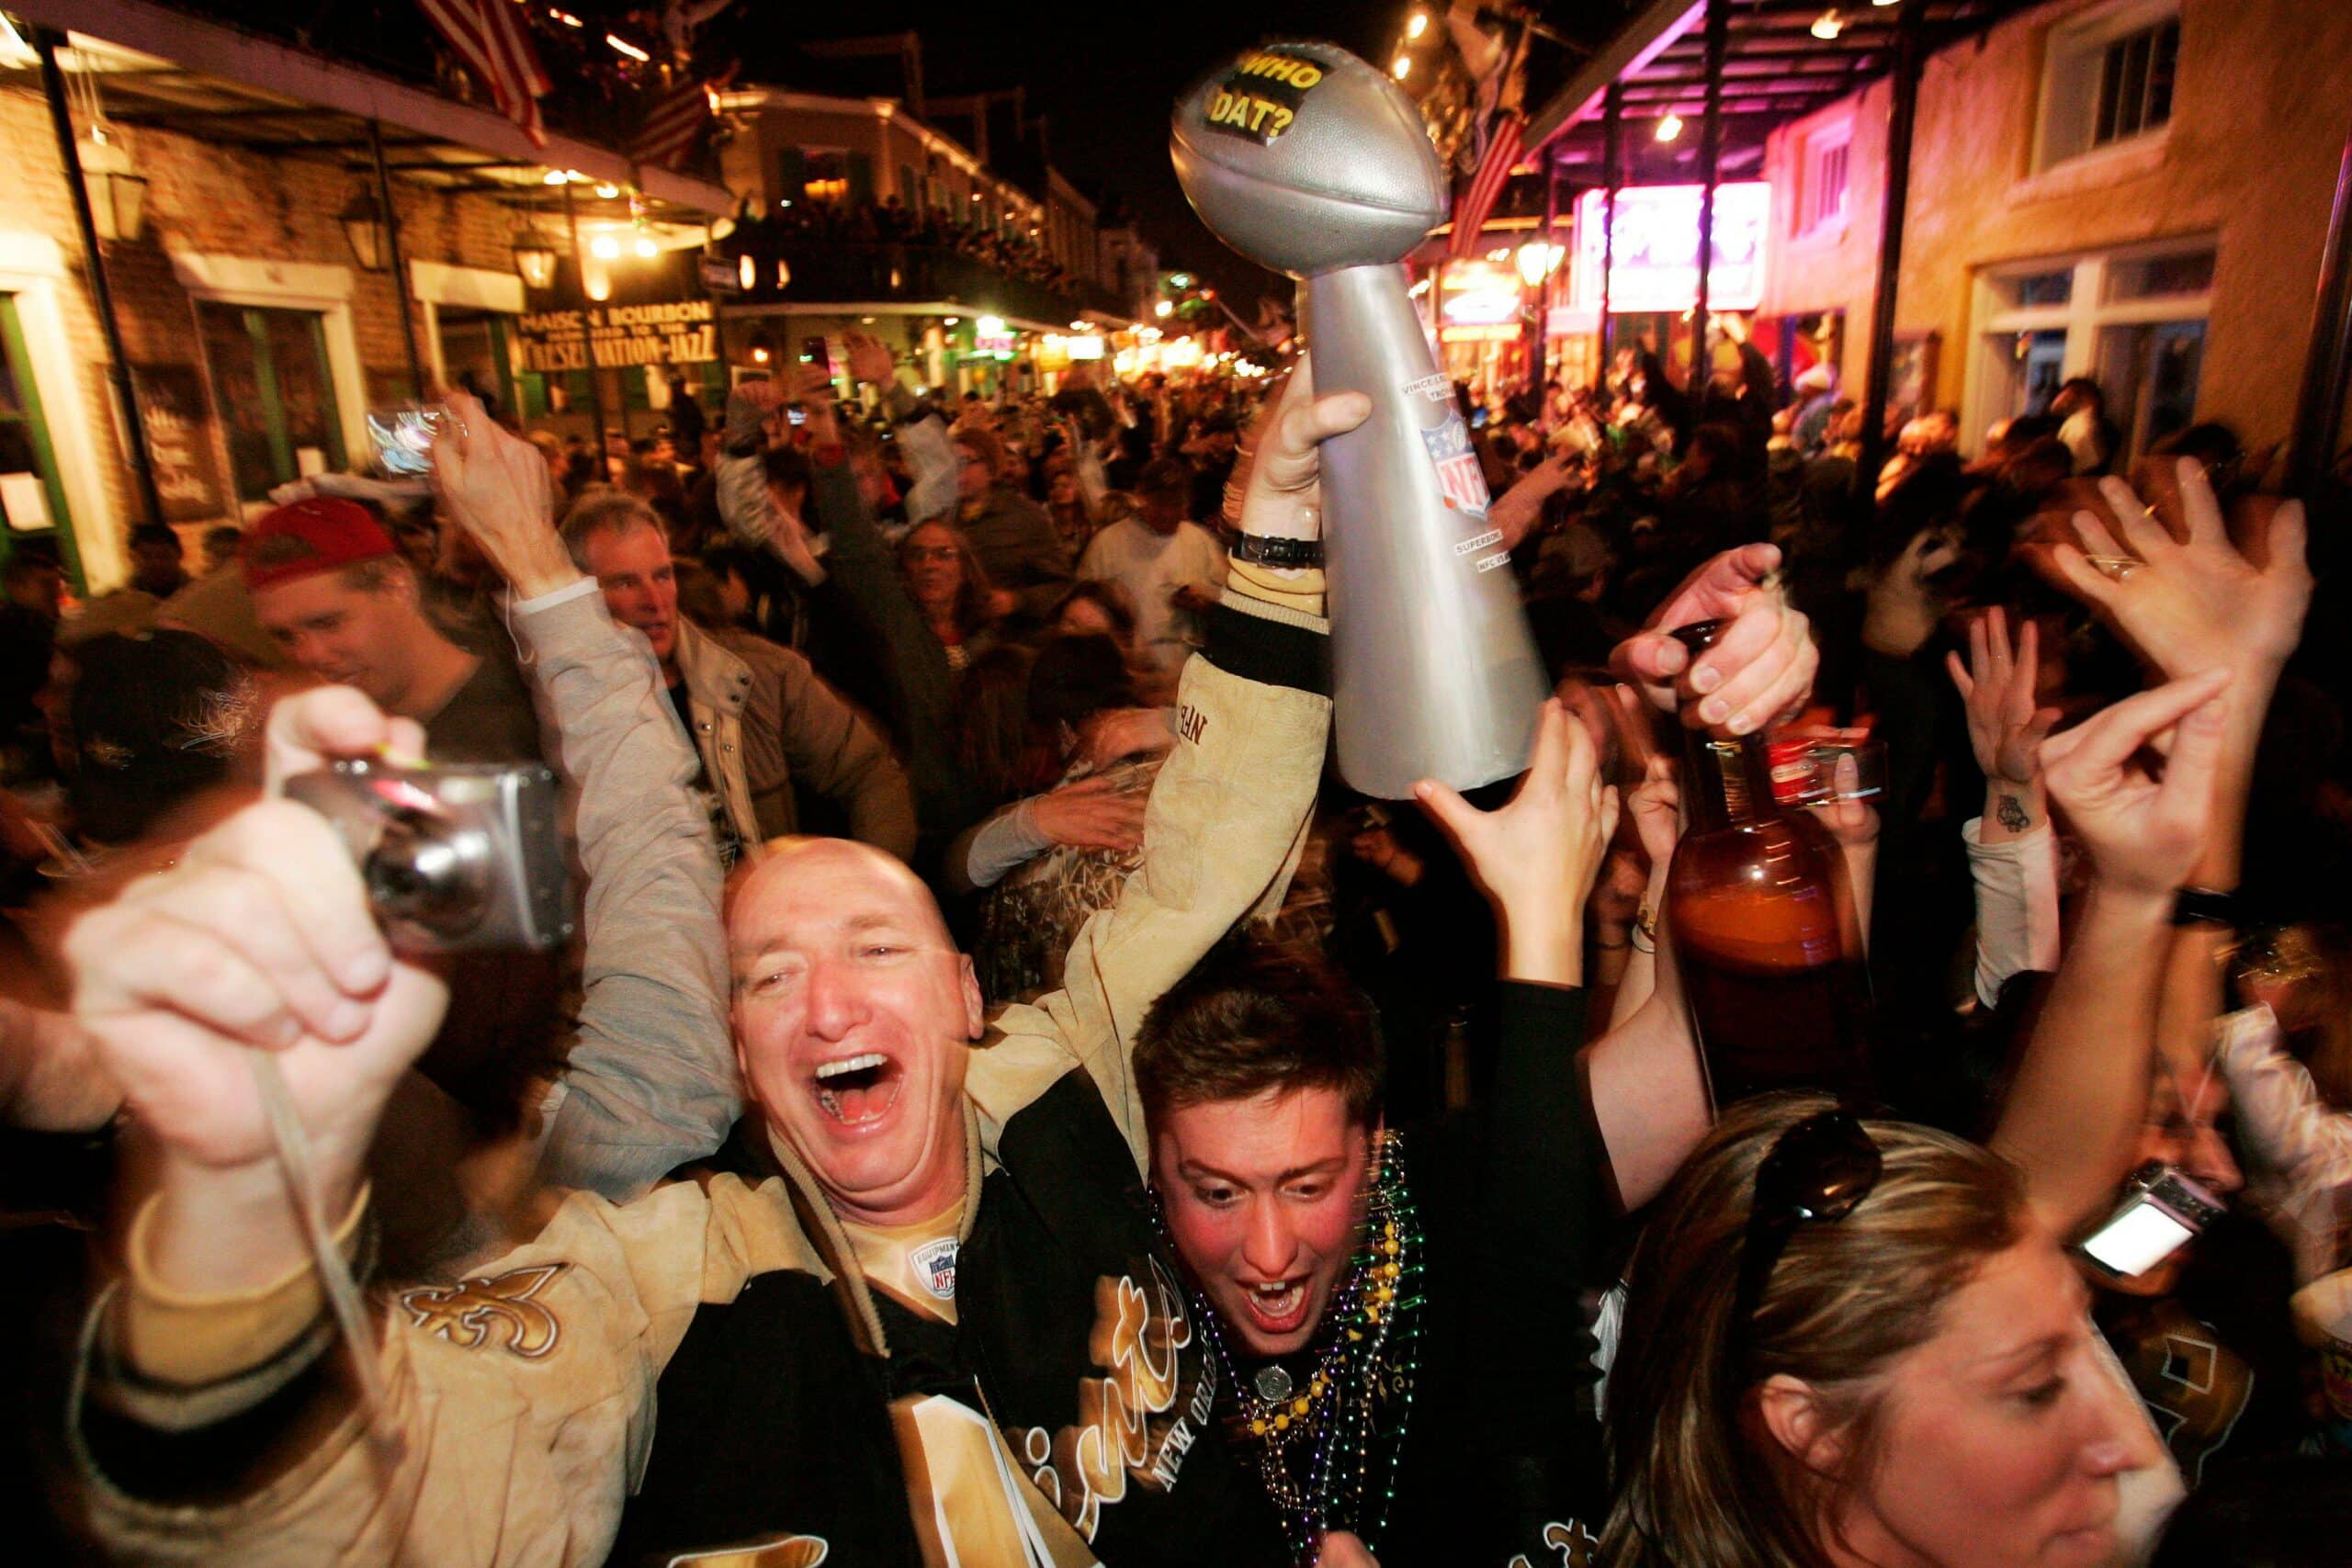
When the Super Bowl arrives, cities don’t just host watch parties — they absorb a sudden surge of alcohol consumption, late-night driving, packed emergency rooms, and unfamiliar crowds moving all at once.
To understand where Super Bowl weekend is safest — and where the risks are highest — we analyzed 32 NFL metro areas using the Super Bowl Safety Index, a data-driven measure of how responsibly cities handle major sporting events. To provide broader context, we also examined how major Canadian metros, where Super Bowl viewership and sports betting activity is high despite the absence of NFL teams, would likely compare under the same behavioral lens.
The index combines DUI enforcement, alcohol-impaired traffic fatalities, emergency room utilization, binge drinking prevalence, ticket scam risk, and police presence. All risk-based metrics were standardized so that higher scores reflect safer Super Bowl environments.
What follows is not about reputation. It’s about behavior — and what the data shows when cities are under pressure.
Key Findings
- Florida’s NFL cities stand out as the safest Super Bowl destinations, pairing low alcohol-impaired fatality rates with strong DUI enforcement.
- Washington, D.C. ranks as the riskiest celebration environment, driven by the highest binge drinking rate in the index.
- Midwestern and Northwestern cities dominate the bottom tier, where high DUI rates and system strain raise risk.
- Police presence and alcohol culture matter more than city size, with smaller metros often outperforming larger ones.
The Riskiest Cities for Super Bowl Celebrations
1. Washington, D.C.
Super Bowl weekend in Washington shows the most concentrated risk profile in the index. The District combines the highest binge drinking rate of any NFL metro with elevated alcohol-related traffic danger and heavy emergency room use.
Key data points
- Binge drinking prevalence: 27.1% (highest in the index)
- Alcohol-impaired traffic fatalities: 39% of all traffic deaths
- ER utilization: 500 visits per 1,000 residents
- DUI arrest rate: 75 per 100,000
- Police presence: No comparable state-level data
2. Seattle, Washington
Seattle enters Super Bowl weekend with one of the thinnest enforcement cushions in the league. Alcohol-related crash risk remains high, while police presence is the lowest of any NFL metro.
Key data points
- Police presence: 2.21 officers per 1,000 residents (lowest)
- Alcohol-impaired traffic fatalities: 35%
- DUI arrest rate: 264 per 100,000
- ER utilization: 366 per 1,000
- Ticket scam risk: High
3. Denver, Colorado
Denver’s Super Bowl risk is driven less by congestion and more by alcohol behavior. Binge drinking and DUI arrests both sit well above safer-city averages.
Key data points
- Binge drinking prevalence: 18.0%
- DUI arrest rate: 267 per 100,000
- Alcohol-impaired traffic fatalities: 34%
- ER utilization: 409 per 1,000
- Police presence: 3.27 per 1,000
4. Minneapolis, Minnesota
Minnesota records the highest DUI arrest rate in the entire index, signaling persistent risk during alcohol-heavy events like the Super Bowl.
Key data points
- DUI arrest rate: 376 per 100,000 (highest)
- Binge drinking prevalence: 17.7%
- Alcohol-impaired traffic fatalities: 29%
- ER utilization: 352 per 1,000
- Police presence: 2.71 per 1,000
5. Cincinnati, Ohio
Cincinnati’s Super Bowl risk is shaped by system strain. Emergency rooms operate near the top of the index even before game-day surges.
Key data points
- ER utilization: 541 visits per 1,000 residents
- Alcohol-impaired traffic fatalities: 37%
- DUI arrest rate: 202 per 100,000
- Binge drinking prevalence: 15.6%
- Police presence: 3.38 per 1,000
6–10. Other High-Risk Super Bowl Cities
- Cleveland, OH (Browns): ER utilization 541 per 1,000; alcohol-impaired fatalities 37%
- Pittsburgh, PA (Steelers): DUI arrest rate 221 per 100,000; ER utilization 489 per 1,000
- Philadelphia, PA (Eagles): DUI arrest rate 221 per 100,000; ER utilization 489 per 1,000
- Dallas, TX (Cowboys): Alcohol-impaired traffic fatalities 42% (among the highest)
- Houston, TX (Texans): Alcohol-impaired traffic fatalities 42%; ticket scam risk highest search interest
The Safest Cities for Super Bowl Celebrations
1. Miami, Florida
Despite its nightlife reputation, Miami posts some of the lowest alcohol-related harm metrics in the NFL landscape.
Key data points
- Alcohol-impaired traffic fatalities: 27%
- DUI arrest rate: 56 per 100,000
- Binge drinking prevalence: 14.2%
- ER utilization: 455 per 1,000
- Police presence: 3.38 per 1,000
2. Tampa, Florida
Tampa mirrors Miami’s safety profile almost exactly, reinforcing Florida’s position at the top of the index.
Key data points
- DUI arrest rate: 56 per 100,000
- Alcohol-impaired traffic fatalities: 27%
- Binge drinking prevalence: 14.2%
- Police presence: 3.38 per 1,000
3. Jacksonville, Florida
Jacksonville completes Florida’s sweep of the safest Super Bowl cities, posting the same low alcohol-harm profile as its in-state peers.
Key data points
- DUI arrest rate: 56 per 100,000
- Alcohol-impaired traffic fatalities: 27%
- ER utilization: 455 per 1,000
- Binge drinking prevalence: 14.2%
- Police presence: 3.38 per 1,000
4. New York City, New York
New York benefits from one of the strongest law-enforcement footprints in the country, which visibly alters behavior during large events.
Key data points
- Police presence: 4.76 officers per 1,000 residents
- DUI arrest rate: 50 per 100,000
- Binge drinking prevalence: 14.9%
- Alcohol-impaired traffic fatalities: 32%
- ER utilization: 452 per 1,000
5. Buffalo, New York
Buffalo matches New York City’s safety metrics, showing that discipline scales down just as effectively.
Key data points
- DUI arrest rate: 50 per 100,000
- Police presence: 4.76 per 1,000
- Binge drinking prevalence: 14.9%
- Alcohol-impaired traffic fatalities: 32%
- ER utilization: 452 per 1,000
How Major Canadian Cities Would Likely Compare
Canada doesn’t host NFL teams, but Super Bowl viewership and betting activity is heavily concentrated in its largest metros, particularly in regulated markets like Ontario, where Ontario sports betting has expanded rapidly. As more fans place game-day bets via mobile betting apps, late-night movement and celebration density can rise in bar districts and transit corridors.
Viewed through the same risk lens — impaired driving prevalence, enforcement strength, and system strain — the safest major Canadian metros for Super Bowl weekend would likely rank as follows:
- Toronto, Ontario
Impaired driving rates of roughly 180–200 per 100,000 residents, among the lowest in Canada, paired with strong enforcement and extensive late-night transit. - Montréal, Québec
Impaired driving rates around 220–240 per 100,000, with dense walkability and transit reducing post-game driving exposure. - Vancouver, British Columbia
Mid-tier risk, with impaired driving rates closer to 260–280 per 100,000 and thinner enforcement margins. - Calgary, Alberta
Higher risk, driven by impaired driving rates often exceeding 350 per 100,000 and car-dependent nightlife. - Edmonton, Alberta
Highest-risk major metro, combining 350+ per 100,000 impaired driving rates with elevated crime severity and system strain.
Across both countries, the pattern holds: Super Bowl safety tracks alcohol behavior and enforcement density — not fandom or city size.
Expert Insight
“The data shows Super Bowl safety isn’t about market size or reputation. It tracks alcohol behavior and enforcement density — and when those align, risk drops sharply.”
Tips for Staying Safe During Super Bowl Weekend
- Lock in transportation plans before kickoff
- Avoid last-minute ticket purchases, when scams peak
- Stick to well-lit, high-traffic areas
- Pace alcohol intake, especially postgame
- Expect DUI enforcement to increase after kickoff and the final whistle
Conclusion
Super Bowl weekend doesn’t create risk — it concentrates it. Cities with strong enforcement, lower binge drinking, and manageable emergency demand absorb the surge. Others reveal pressure points that turn celebration into liability. Knowing where those fault lines sit is part of understanding the game beyond the field.
Methodology & Sources
Methodology
The Super Bowl Safety Index ranks 32 NFL metro areas using six indicators: DUI arrest rates, alcohol-impaired traffic fatalities, emergency room utilization, ticket scam risk, binge drinking prevalence, and police presence. All risk metrics were normalized and inverted so higher values reflect safer conditions. Police presence was weighted positively.
Sources
- FBI Crime Data Explorer — DUI arrests and law enforcement data
- NHTSA — Alcohol-impaired traffic fatalities (U.S.)
- KFF State Health Facts — Binge drinking prevalence and emergency care utilization
- Statistics Canada — Police-reported impaired driving rates and Crime Severity Index
- Transport Canada — Alcohol-related collision trends