Flyers Choke: Playoff Dreams Dashed
The Flyers were the third-best team in the NHL’s Metropolitan Division on March 24th, just one day after defeating the Boston Bruins. They had a two-point lead over the Washington Capitals, a five-point lead over the New York Islanders, and an 11-point lead on the Pittsburgh Penguins. However, after losing eight games in a row, the Flyers are now the sixth-best team in the division, as Washington, New York, and Pittsburgh have all passed Philadelphia by. The Flyers were the favourites in five out of the eight games, too.
| Date | Away | Home | Win Prob | Result |
| Mar. 24 | FLA | PHI | 0.416 | L |
| Mar. 26 | PHI | NYR | 0.379 | L |
| Mar. 28 | PHI | MTL | 0.596 | L |
| Mar. 30 | CHI | PHI | 0.729 | L |
| Apr. 1 | NYI | PHI | 0.530 | L |
| Apr. 5 | PHI | BUF | 0.486 | L |
| Apr. 6 | PHI | CBJ | 0.607 | L |
| Apr. 9 | PHI | MTL | 0.565 | L |
Out of curiosity, I decided to simulate Philadelphia’s last eight games 100,000 times using the game odds above to get a sense of just how bad the Flyers choked. The Flyers only went 0-8 in 156 out of 100,000 simulations, meaning that it only happened roughly 0.16% of the time. This never should have happened. In fact, the Flyers managed to win four or more games in roughly 72% of simulations, so they choked about as hard as they possibly could have.
According to CSB’s NHL projection model, the Flyers now have just a 3.7% chance of making the Stanley Cup playoffs.
McDavid Will Be A Game-Time Decision On Wednesday
According to Daily Faceoff’s Jason Gregor, Connor McDavid will not play on Wednesday versus the Vegas Golden Knights after the Oilers’ captain missed practice on Monday and Tuesday due to a lower-body injury. However, McDavid skated on Wednesday, and head coach Kris Knoblauch said that although he doesn’t want McDavid to rush things, he will leave it up to him as to whether or not he plays on Wednesday. These conflicting reports make this a hard game to handicap, but it could create a situation where there’s a lot of value on Edmonton if McDavid is in the lineup.
I wrote about McDavid’s impact on the NHL betting market back in October when he missed two games, and the market has reacted to this news in a similar way. NorthStar Bets opened up with Edmonton listed as a -156 favourite, but the Oilers’ odds were down to -125 by noon local time on Tuesday and they have since moved to -119. If McDavid is in the lineup, Edmonton’s odds should shoot back up to around -160, but if he doesn’t play, the Oilers’ chances will drop even more.
McDavid has only missed 15 games since the start of the 2016-17 regular season and the Oilers have gone 5-10 straight-up. The Oilers have also scored just 2.33 goals per game without McDavid in the lineup, compared to 3.27 goals per game with him in the lineup.
Bet on Oilers vs. Golden Knights
EDM -119
VGK -102
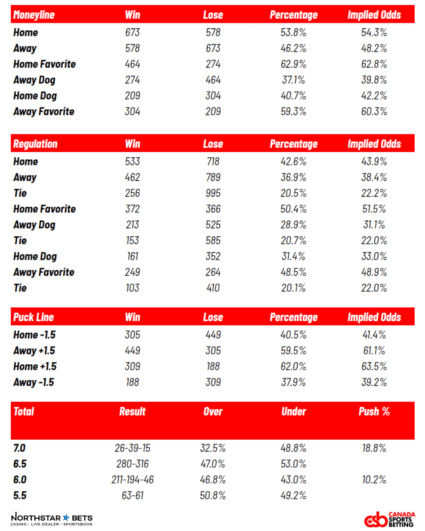
Updated NHL Betting Trends
With just 61 games left on the NHL regular season schedule, it’s time to look back on the 2023-24 campaign from a betting perspective before shifting gears to the playoffs.
Most and Least Profitable NHL Teams
The St. Louis Blues are going to miss the playoffs, but there’s a good chance they will finish as the most profitable moneyline bet year-to-date. The table below contains a list of the most and least profitable moneyline bets in the NHL this season.
| Team | GP | Road Win % | Road Odds | Away $ | Home Win % | Home Prob | Home $ | Total $ |
| STL | 78 | 45.0% | 42.8% | $3.80 | 60.5% | 47.8% | $11.78 | $15.59 |
| NYR | 79 | 61.0% | 55.7% | $5.78 | 73.7% | 62.6% | $6.84 | $12.62 |
| NSH | 79 | 59.0% | 48.7% | $8.77 | 55.0% | 55.4% | -$0.79 | $7.98 |
| VAN | 78 | 56.4% | 53.3% | $3.05 | 66.7% | 59.9% | $4.68 | $7.74 |
| WSH | 78 | 43.6% | 40.7% | $3.54 | 51.3% | 48.3% | $2.49 | $6.03 |
| WPG | 78 | 59.0% | 54.3% | $3.98 | 64.1% | 60.6% | $1.42 | $5.40 |
| FLA | 79 | 63.4% | 55.9% | $4.52 | 60.5% | 64.2% | -$1.29 | $3.24 |
| TBL | 78 | 50.0% | 51.2% | -$1.34 | 63.2% | 57.3% | $4.20 | $2.86 |
| TOR | 78 | 61.5% | 56.1% | $3.74 | 56.4% | 59.8% | -$1.91 | $1.84 |
| DAL | 79 | 63.4% | 58.1% | $3.17 | 63.2% | 64.1% | -$1.48 | $1.69 |
| DET | 78 | 42.1% | 43.5% | -$2.98 | 55.0% | 51.7% | $3.40 | $0.41 |
| CAR | 79 | 60.5% | 58.9% | $0.87 | 65.9% | 66.3% | -$0.60 | $0.27 |
| COL | 79 | 47.5% | 57.1% | -$6.39 | 76.9% | 65.4% | $6.59 | $0.20 |
| BOS | 79 | 56.4% | 56.3% | $0.87 | 60.0% | 63.4% | -$2.05 | -$1.18 |
| PHI | 79 | 42.5% | 45.3% | -$0.05 | 48.7% | 51.3% | -$1.46 | -$1.51 |
| BUF | 79 | 43.6% | 44.0% | -$0.97 | 50.0% | 52.2% | -$0.95 | -$1.92 |
| EDM | 76 | 53.8% | 60.7% | -$4.12 | 70.3% | 65.8% | $1.88 | -$2.24 |
| VGK | 77 | 45.0% | 54.0% | -$6.38 | 64.9% | 59.9% | $4.07 | -$2.31 |
| MTL | 78 | 36.8% | 35.6% | -$0.74 | 40.0% | 42.5% | -$4.14 | -$4.88 |
| LAK | 78 | 53.7% | 54.6% | -$0.13 | 51.4% | 60.4% | -$5.98 | -$6.11 |
| ANA | 79 | 35.9% | 33.8% | $1.92 | 30.0% | 39.7% | -$8.65 | -$6.73 |
| NYI | 78 | 43.6% | 49.2% | -$3.23 | 48.7% | 54.7% | -$3.77 | -$7.01 |
| ARI | 78 | 31.6% | 42.4% | -$11.82 | 52.5% | 47.2% | $3.64 | -$8.18 |
| CGY | 77 | 42.1% | 48.7% | -$5.68 | 48.7% | 53.8% | -$2.70 | -$8.39 |
| OTT | 78 | 36.8% | 46.0% | -$6.44 | 50.0% | 52.9% | -$2.32 | -$8.76 |
| MIN | 78 | 44.7% | 48.4% | -$3.29 | 50.0% | 55.4% | -$5.69 | -$8.98 |
| PIT | 78 | 37.5% | 50.5% | -$10.83 | 55.3% | 56.8% | -$0.19 | -$11.01 |
| CBJ | 79 | 25.6% | 36.0% | -$14.11 | 40.0% | 40.2% | $2.89 | -$11.22 |
| CHI | 77 | 18.4% | 30.2% | -$15.23 | 41.0% | 37.4% | $3.36 | -$11.86 |
| NJD | 79 | 51.3% | 51.3% | -$0.59 | 42.5% | 59.6% | -$11.77 | -$12.36 |
| SEA | 77 | 43.2% | 47.4% | -$3.18 | 42.5% | 52.9% | -$9.27 | -$12.45 |
| SJS | 78 | 18.4% | 28.4% | -$11.77 | 27.5% | 32.6% | -$5.87 | -$17.64 |