Updated NHL Betting Trends as of Feb. 6th
Super Bowl 58 will take centre stage this week but don’t forget about the NHL. The All-Star Game might be in the rearview, but the trade deadline is still a month away, and that means there are still more than 500 regular season games that have yet to be played. Teams will be well-rested coming out of the break, as our very own Jeff Veillette points out in this week’s schedule breakdown, but the next couple of months will be a grind, with no break in the schedule in sight. This is the quiet before the storm, which makes now a great time to take a look at league trends using betting data from the 782 games that have already been played this season. The table below provides insights into things like home-ice advantage and how often teams cover the puck line, but bettors can also learn about how puck lines, regulation lines, and totals are priced by studying the NHL betting data below.
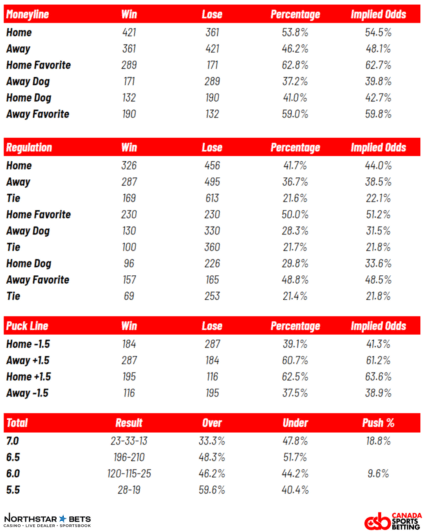
An easy way to read the table is to compare the percentage to the implied odds in each row. If the percentage is higher than the implied odds, there may be a discrepancy in how that particular market is being priced. Now, with that said, the big takeaway should be that major NHL betting markets are hard to beat on a macro level. The second takeaway should be that games with a total of 5.5 have gone over nearly 60 percent of the time. Of course, it’s a small sample, but the last 22 of the last 32 games that have closed with a total of 5.5 have featured six or more goals. In other words, the over (5.5 goals) has hit nearly 69% of the time. Nice. The third thing that stands out is the rate at which games have gone to overtime and shootouts. It’s not far from the norm, but based on the implied odds of a “tie”, bettors should give more consideration to betting on games to end in a regulation time draw.
Team Money Leaders
If we dive a little deeper into this season’s betting data, we can see which teams have been the most and least profitable ($) on the moneyline. This is calculated by summing the amount that would have been won by placing a $1 bet to win every game year-to-date. Additionally, home and road splits provide important context, but each team’s average odds might be the most important piece of NHL betting data in the table.
| Team | GP | W | L | T | Tot $ | Road GP | Road W% | Avg Road Odds | Road $ | Home GP | Home W% | Avg Home Odds | Home $ |
|---|---|---|---|---|---|---|---|---|---|---|---|---|---|
| VAN | 49 | 33 | 16 | 8 | $11.79 | 25 | 60.0% | -110 | $4.80 | 24 | 75.0% | -146 | $6.99 |
| STL | 49 | 26 | 23 | 9 | $10.80 | 24 | 45.8% | +133 | $3.78 | 25 | 60.0% | +109 | $7.02 |
| WPG | 47 | 30 | 17 | 8 | $6.15 | 22 | 63.6% | -119 | $4.31 | 25 | 64.0% | -143 | $1.85 |
| DET | 50 | 26 | 24 | 12 | $4.47 | 23 | 52.2% | +127 | $3.29 | 27 | 51.9% | -105 | $1.18 |
| WSH | 47 | 23 | 24 | 13 | $3.52 | 23 | 43.5% | +133 | $1.27 | 24 | 54.2% | +107 | $2.25 |
| NYR | 50 | 31 | 19 | 9 | $3.18 | 27 | 55.6% | -131 | $0.54 | 23 | 69.6% | -171 | $2.64 |
| PHI | 50 | 24 | 26 | 13 | $3.13 | 25 | 56.0% | +127 | $7.73 | 25 | 40.0% | +101 | -$4.60 |
| EDM | 45 | 30 | 15 | 6 | $2.62 | 22 | 59.1% | -150 | -$0.40 | 23 | 73.9% | -187 | $3.03 |
| COL | 50 | 32 | 18 | 8 | $2.47 | 25 | 48.0% | -134 | -$3.18 | 25 | 80.0% | -185 | $5.65 |
| FLA | 49 | 30 | 19 | 8 | $2.14 | 26 | 61.5% | -128 | $1.45 | 23 | 60.9% | -164 | $0.70 |
| VGK | 50 | 29 | 21 | 13 | $1.99 | 25 | 44.0% | -116 | -$4.18 | 25 | 72.0% | -151 | $6.17 |
| BOS | 49 | 31 | 18 | 15 | $1.61 | 26 | 57.7% | -140 | -$0.24 | 23 | 69.6% | -186 | $1.84 |
| NSH | 51 | 26 | 25 | 8 | $1.41 | 25 | 52.0% | +114 | $3.39 | 26 | 50.0% | -117 | -$1.99 |
| ANA | 50 | 18 | 32 | 8 | $0.20 | 24 | 41.7% | +195 | $6.34 | 26 | 30.8% | +143 | -$6.14 |
| ARI | 48 | 23 | 25 | 8 | $0.07 | 24 | 33.3% | +140 | -$6.44 | 24 | 62.5% | +105 | $6.50 |
| TBL | 50 | 27 | 23 | 10 | -$0.08 | 25 | 40.0% | -102 | -$5.52 | 25 | 68.0% | -127 | $5.44 |
| DAL | 49 | 30 | 19 | 15 | -$0.54 | 23 | 60.9% | -132 | $1.44 | 26 | 61.5% | -181 | -$1.98 |
| MTL | 49 | 20 | 29 | 17 | -$1.22 | 24 | 41.7% | +161 | $0.93 | 25 | 40.0% | +136 | -$2.15 |
| BUF | 49 | 22 | 27 | 6 | -$2.21 | 25 | 44.0% | +130 | $1.33 | 24 | 45.8% | -116 | -$3.53 |
| CAR | 48 | 28 | 20 | 9 | -$3.00 | 24 | 54.2% | -136 | -$1.48 | 24 | 62.5% | -199 | -$1.53 |
| SJS | 51 | 14 | 37 | 9 | -$4.30 | 27 | 18.5% | +248 | -$8.52 | 24 | 37.5% | +211 | $4.22 |
| TOR | 48 | 25 | 23 | 17 | -$4.72 | 25 | 56.0% | -132 | $0.19 | 23 | 47.8% | -158 | -$4.91 |
| PIT | 46 | 22 | 24 | 9 | -$5.48 | 23 | 43.5% | -115 | -$4.75 | 23 | 52.2% | -130 | -$0.72 |
| NJD | 47 | 24 | 23 | 8 | -$5.56 | 24 | 58.3% | -107 | $1.84 | 23 | 43.5% | -174 | -$7.41 |
| CBJ | 50 | 16 | 34 | 15 | -$7.18 | 24 | 29.2% | +184 | -$4.40 | 26 | 34.6% | +140 | -$2.78 |
| NYI | 50 | 21 | 29 | 17 | -$7.71 | 25 | 36.0% | +110 | -$4.87 | 25 | 48.0% | -122 | -$2.84 |
| CGY | 49 | 22 | 27 | 9 | -$7.80 | 25 | 40.0% | -103 | -$5.93 | 24 | 50.0% | -118 | -$1.87 |
| LAK | 48 | 23 | 25 | 12 | -$8.15 | 25 | 60.0% | -126 | $2.11 | 23 | 34.8% | -155 | -$10.26 |
| MIN | 49 | 21 | 28 | 11 | -$8.42 | 23 | 39.1% | +113 | -$3.54 | 26 | 46.2% | -120 | -$4.88 |
| OTT | 47 | 20 | 27 | 7 | -$8.58 | 20 | 35.0% | +118 | -$4.81 | 27 | 48.1% | -116 | -$3.76 |
| CHI | 50 | 14 | 36 | 7 | -$8.93 | 28 | 14.3% | +246 | -$14.00 | 22 | 45.5% | +165 | $5.07 |
| SEA | 50 | 21 | 29 | 14 | -$9.29 | 26 | 38.5% | +110 | -$4.92 | 24 | 45.8% | -113 | -$4.37 |
This table and the one above should be seen as a starting point for analysis. In other words, if a bettor sees something interesting, they should dig deeper and conduct a more rigorous statistical analysis. Take the St. Louis Blues for example, a square bettor might have looked at them heading into the All-Star break and been awestruck by the fact that they managed to rattle off five wins in a row. But, as friend-of-the-show Nick Martin pointed out on Twitter, basing a handicap on past results won’t get you very far.
I mean, not only did the Blues need overtime to pull off their last three victories, but they were objectively bad through the lens of analytics. According to Evolving Hockey, St. Louis graded out as a bottom-five team in shot attempt percentage and expected goals percentage during their five-game win streak. Don’t buy high on a team that has been running hot for no good reason, and don’t base bets on surface-level NHL betting data.
More NHL Content from CSB
- Will the Edmonton Oilers make history on Tuesday in Vegas? Jeff Veillette breaks it all down in his game preview and last week’s article provides advice from yours truly on how I handicapped a prop that is available at NorthStar Bets and is still relevant today.
- Get updated NHL projected standings and Stanley Cup playoff chances daily here, and check out our strength of schedule metric to inform your futures betting.