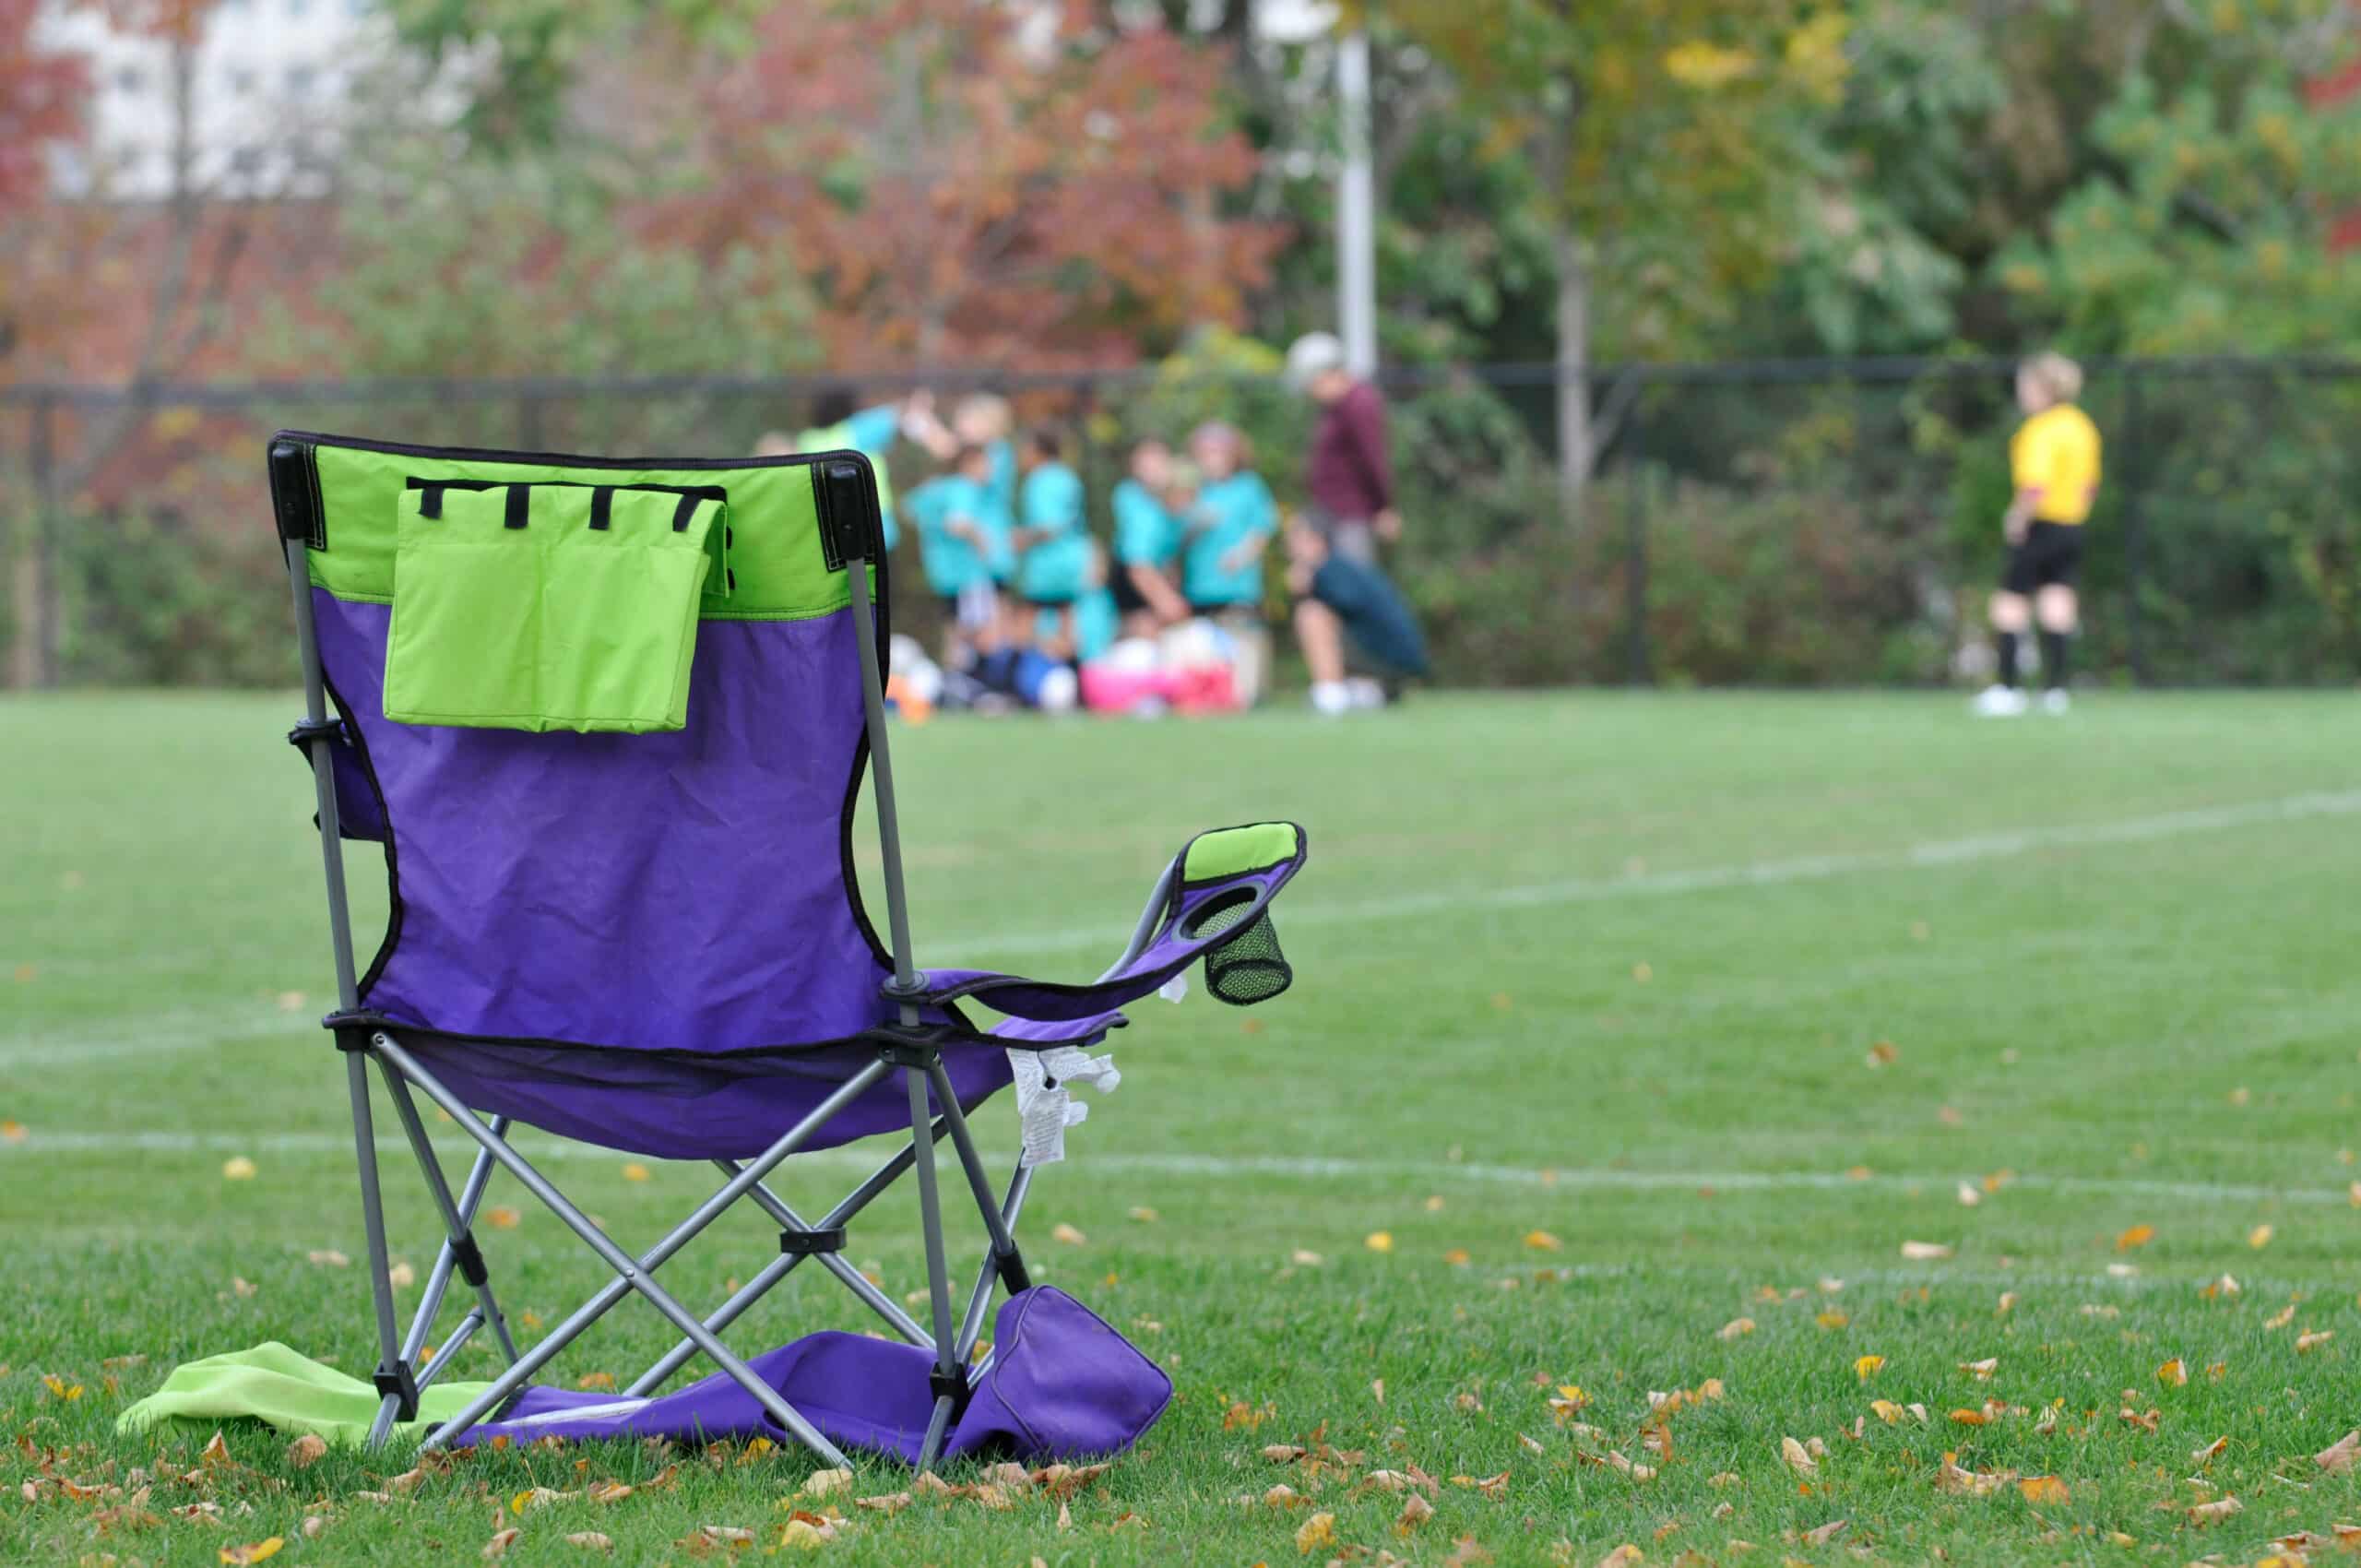
Soccer moms aren’t just a pop-culture stereotype — they’re a full-blown lifestyle category. Weekend tournaments, minivan carpools, post-game snacks, and endless driving miles aren’t randomly distributed across North America.
And to be clear: “soccer mom” isn’t just about soccer. It’s a mindset — the all-in youth sports parent who lives by the practice schedule and measures time in carpools, snack rotations, and weekend brackets. One day it’s a soccer bag, the next it’s baseball gear, cheer uniforms, hockey pads, or a dance costume stuffed into the backseat.
Depending on where you live, the odds of becoming a “soccer mom” might already be baked into your zip code.
To find where the soccer mom lifestyle is most likely, we analyzed youth sports participation across all youth sports (not just soccer), along with van ownership rates, miles driven per capita, and family size.
The result is a list of North America’s biggest soccer mom hotspots — the places where sideline culture is basically a way of life.
Key Findings
- Texas is the undisputed U.S. favorite, with a 30.14% chance of being a soccer mom—if you live here, the odds of folding-chair duty, snack rotations, and weekend tournaments are higher than anywhere else.
- Wyoming isn’t far behind at 28.52%, thanks to long drives (16,501 miles per capita) and van-heavy households. Soccer moms here spend as much time on the highway as on the sidelines.
- Canada’s leaders are Saskatchewan (18.78%), Quebec (15.66%), and Alberta (15.40%), followed by Yukon (13.36%) and Nova Scotia (9.39%). In places like Yukon, even a “quick practice drop-off” can turn into a multi-hour adventure.
America’s Most Likely Soccer Mom States
| Rank | State | Sports Participation | Miles Per Capita | Kids Per Capita | Vans Per Capita | Probability | Odds |
|---|---|---|---|---|---|---|---|
| 1 | Texas | 859,301 | 10,305 | 102.43 | 397.03 | 30.14% | +232 |
| 2 | Wyoming | 21,213 | 16,501 | 101.41 | 622.89 | 28.52% | +251 |
| 3 | North Dakota | 29,091 | 12,702 | 101.67 | 518.76 | 17.48% | +472 |
| 4 | Mississippi | 124,321 | 13,827 | 96.39 | 469.80 | 16.50% | +506 |
| 5 | Nebraska | 80,827 | 10,846 | 103.87 | 469.76 | 15.45% | +547 |
1. Texas – 30.14%
Texas has the highest youth sports participation in the country (859,301 participants), and it pairs that with large family size and a heavy driving lifestyle. In other words: lots of kids, lots of sports, lots of commuting.
Even its van ownership isn’t “#1,” but it doesn’t need to be — Texas is so dominant in sheer scale of sports participation that it overwhelms the field. In other words: if you’re raising kids in Texas, the odds of ending up in a folding chair on a Saturday morning sideline are extremely high.
2. Wyoming – 28.52%
Wyoming finishes a close second, powered largely by its high miles-driven-per-capita and van-heavy vehicle profile. The Cowboy State is the kind of place where “quick practice drop-off” can mean a 40-minute drive.
With the highest miles driven per capita in the country (16,501), Wyoming isn’t just a sports-parent state — it’s a sports-roadtrip state. If your kid plays travel ball in Wyoming, congratulations: you’ve basically joined a touring band.
3. North Dakota – 17.48%
North Dakota ranks third thanks to a classic soccer mom recipe: big families, long drives, and a whole lot of youth sports culture packed into a small population. The state scores extremely high on kids per capita (101.67) and also racks up major miles driven per person (12,702).
Van ownership is also near the top tier (518.76 per capita), which basically confirms what the numbers are already saying: this is a state built for hauling kids, gear, and post-game snacks across wide-open distances. If you live in North Dakota, your car is not just transportation — it’s a second home that may smell vaguely like orange slices.
4. Mississippi – 16.50%
Mississippi lands in the top five because it checks nearly every “sports parent lifestyle” box. It’s one of the highest states in miles driven per capita (13,827), has strong family size numbers, and boasts high van ownership
The result is a state where youth sports aren’t just an after-school activity — they’re part of the weekly rhythm. Mississippi might not be the first place people picture when they hear “soccer mom,” but the data says the sideline culture is thriving.
5. Nebraska – 15.45%
Nebraska rounds out the top five as one of the most family-driven states in the country. It has one of the highest kids-per-capita scores in the dataset (103.87), plus strong van ownership (469.76) and steady miles driven (10,846).
Youth sports participation (80,827) is also huge relative to the state’s population size, which suggests sports aren’t optional — they’re expected. Nebraska is the kind of place where every weekend feels like a tournament weekend, and the minivan isn’t a vehicle so much as a mobile equipment locker.
Absolutely — and Canada basically demands a hockey mom line 😂. Here’s your Canadian Top 5 with a little more local flavor baked in (still clean enough for a publishable listicle).
U.S. Category Winners
- Highest Youth Sports Participation: Texas (859,301 kids)
- Longest Drives: Wyoming (16,501 miles per capita)
- Biggest Families: Utah (105.86 kids per household)
- Most Vans: Idaho (518.45 vans per 1,000 residents)
Canada’s Most Likely Soccer Mom Provinces
| Rank | Province/ Region | Sport Participation % | KM Per Capita | 3+ Kids Per Capita | Vans Per Capita | Probability | Odds |
|---|---|---|---|---|---|---|---|
| 1 | Saskatchewan | 71 | 9,849 | 41.6 | 42.34 | 8.17% | +1,124 |
| 2 | Quebec | 77 | 7,820 | 26.5 | 38.80 | 4.01% | +2,391 |
| 3 | Alberta | 66 | 1,0356 | 37.3 | 46.37 | 6.70% | +1,392 |
| 4 | Yukon | 56 | 1,2164 | 25.4 | 68.68 | 3.80% | +2,534 |
| 5 | Nova Scotia | 66 | 1,0391 | 23.1 | 31.56 | 3.41% | +2,835 |
1. Saskatchewan — 18.78%
Saskatchewan takes the top spot in Canada thanks to its perfect storm of youth sports culture and big-family energy. It posts one of the strongest sport participation rates in the country (71%) and pairs it with the highest “3+ kids per capita” rate in Canada (41.62).
It also scores high on driving distance (9,849 km per capita) and sits near the top in van ownership (42.34 per capita). In other words: more kids, more gear, more practices — and plenty of road between them. If you’re raising a family in Saskatchewan, the odds of spending your weekends in a folding chair next to a field (or in a freezing arena bleacher) are basically built into the lifestyle.
2. Quebec — 15.66%
Quebec finishes second largely because it dominates the youth sports participation category, ranking #1 in sport participation rate (77%). It also pairs that with strong family size numbers (26.51 3+ kids per capita) and solid van ownership (38.80).
Quebec doesn’t rack up the same sky-high driving distances as some of the prairie provinces (7,820 km per capita), but it doesn’t need to — the sports culture alone carries it. In Quebec, youth sports aren’t just an activity. They’re part of the schedule, part of the identity, and part of the weekend routine. If you’ve ever seen a parent carrying a hockey bag that looks heavier than the kid, you already understand the vibe.
3. Alberta — 15.40%
Alberta lands third and honestly feels like the most “classic” sports-parent province in the dataset. Its youth sports participation is strong (66%), but what really boosts it is the combination of high driving distance (10,356 km per capita), large family size (37.33 3+ kids per capita), and one of the highest van ownership rates in Canada (46.37).
In other words: Alberta isn’t just raising kids — it’s transporting them like a full-time job. If your kid plays travel hockey, soccer, baseball, cheer, or dance in Alberta, your vehicle is basically a second home. And if you’re an Alberta hockey mom, you’ve probably said “we’ll just grab Tim Hortons on the way” more times than you can count.
4. Yukon — 13.36%
Yukon ranks fourth, powered by two things that basically define the sports-parent lifestyle: driving and van ownership. Yukon has the highest kilometers driven per capita in Canada (12,164 km), and it absolutely dominates the van category with an off-the-charts van ownership rate (68.68 per capita).
Youth sports participation (56%) isn’t as high as some other provinces, but the geography does the heavy lifting here. In Yukon, “practice drop-off” isn’t a quick errand — it’s a commitment. If you’re a Yukon hockey mom, you’re not carpooling… you’re basically running logistics for a small traveling team.
5. Nova Scotia — 9.39%
Nova Scotia rounds out the Canadian top five with one of the strongest overall “sports parent” profiles outside the top provinces. It posts a high youth sports participation rate (66%), solid driving distance (10,391 km per capita), and respectable van ownership (31.56).
It also sits above average in family size (23.11 3+ kids per capita), which helps explain why it punches above its weight. Nova Scotia might not have the same minivan dominance as Yukon or Alberta, but the numbers suggest the youth sports culture is thriving — the kind of place where weekends disappear into tournaments, team snacks, and early-morning drives. Basically: if you’ve ever packed a cooler for a “quick game” and accidentally made it a full-day event, Nova Scotia gets you.
Canadian Category Winners
- Highest Youth Sports Participation: Quebec (77% of kids involved)
- Longest Drives: Yukon (12,164 km per capita)
- Biggest Families: Yukon (68.68 families with 3+ kids per 1,000 households)
- Most Vans: Yukon (68.68 vans per 1,000 residents)
Why Soccer Moms Are Basically Heroes (and Sometimes Sleep-Deprived)
Soccer moms aren’t just shuttling kids around—they’re running what might as well be a small logistics company. From weekend tournaments to minivan carpools, post-game snacks, and forgotten cleats, they live and breathe the youth sports schedule. “Soccer mom” is just shorthand for the all-in sports-parent mindset: one day it’s a soccer bag, the next it’s baseball gear, hockey pads, cheer uniforms, or dance costumes crammed into the backseat. Depending on where you live, your zip code might come with a built-in subscription to folding-chair sideline duty, early-morning practices, and enough snack rotations to fuel a small army. And hey, if in between cheering for your kid on the sidelines you’re looking for a little extra excitement for hockey game you’re discretely watching on your phone, consider checking out the best betting sites.
Methodology: How We Calculated Soccer Mom Odds
We wanted to know: where in North America is the soccer mom lifestyle baked into the weekend schedule? To answer that, we created a Soccer Mom Index — a simple way to measure how likely it is that parents are living and breathing youth sports, folding chairs in tow.
We looked at four big factors that really capture the “soccer mom mindset”: how many kids you’re hauling around, how far you drive, how much youth sports are part of life, and whether you have a van (or two) to carry it all.
In the U.S.
Each state got a score based on:
- Youth sports participation per capita — more kids playing = more sidelines to occupy.
- Miles driven per capita — because nothing says soccer mom like long practice drop-offs and weekend tournaments.
- Kids per household — big families mean more folding chairs, more snacks, more gear.
- Van ownership per capita — the ultimate youth-sports-mobile.
Sources: NFHS 2023–24 High School Athletics Participation Survey, Kelley Blue Book, U.S. Census Bureau ACS Tables B11003 & B09002, Bureau of Transportation Statistics VIUS.
In Canada
We used similar measures, adjusted for available data:
- Youth sports participation rates
- Vehicle kilometers driven per capita
- Share of families with 3+ kids
- Vans per capita
Sources: CFLRI Sport Participation Among Children and Youth, Natural Resources Canada Transportation Statistics, Statistics Canada Tables 11-10-0013-01 & 23-10-0308-01.
You can see the full dataset here.
How the Index Works
Each metric was converted to a 0–100 scale and combined into a final Soccer Mom Index score. We then translated those scores into:
- Implied probability — how likely it is a region is full of soccer-mom energy relative to others
- American odds — because everyone understands “favorite” vs. “long shot”
Lower odds mean a state or province is basically a soccer mom powerhouse, while longer odds suggest a quieter sideline scene.
In short: if your region scores high, be ready for weekend practices, team snacks, minivan Tetris, and the occasional accidental orange slice under the seat. Your car is probably a second home, and you’re already living the lifestyle.