While puck drop times are clearly listed on every NHL schedule, one hidden factor can truly make or break a team’s season: time zone travel.
Canada Sports Betting analyzed over 1,300 NHL matchups from the 2025–26 regular season to identify which teams performed best depending on game location and timing. From rising contenders like the Washington Capitals and Winnipeg Jets to the Florida Panthers — winners of the 2026 Stanley Cup — the data reveals who truly mastered the season’s time zone challenges.

Each team’s performance was evaluated based on win rate and average goal differential, and then assigned a Performance Score on a 0–100 scale to allow for direct comparison across teams and time zones. The methodology is explained in detail at the bottom of the page.
Top Performing NHL Teams in Their Home Time Zones
Home ice advantage is about more than fan support—it’s about routine, comfort, and rest. Here are the top five teams that dominated in their familiar time zones:
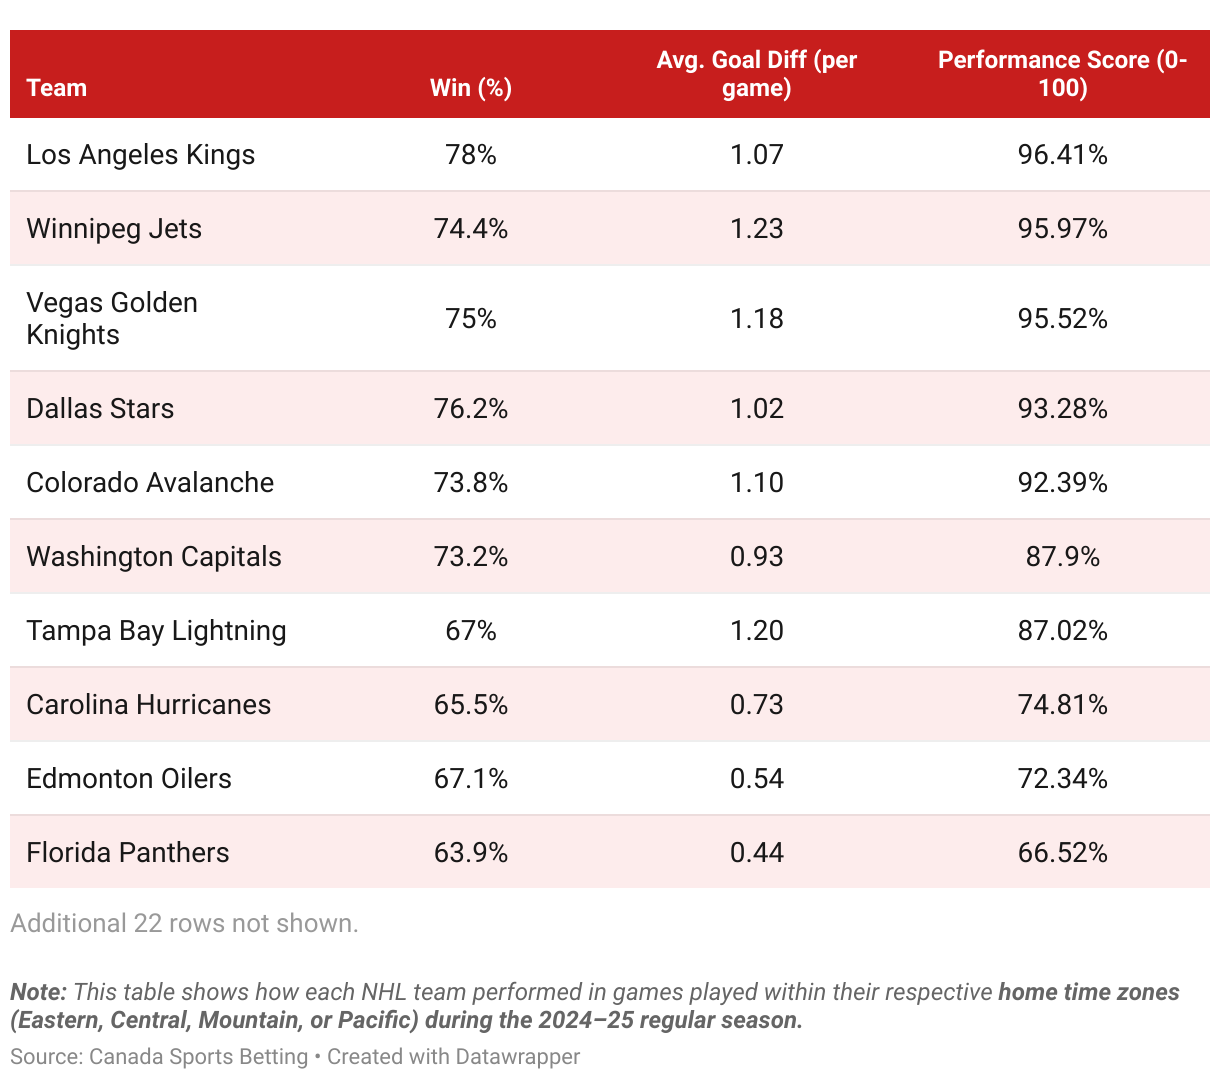
#1 Home Ice Hero: Los Angeles Kings
With a winning percentage of 78% and a robust average goal differential of +1.07, the Kings posted the highest overall home zone score of 96.41, proving comfort truly is king.
#2 Winnipeg Jets
The Jets soared at home with a performance score of 95.97, dominating Central time zone games with clinical precision, thanks to their stellar 74.4% win rate and an impressive +1.23 goal differential.
#3 Vegas Golden Knights
Playing in their home Pacific zone, Vegas scored 95.52, posting a strong 75% winning record with a goal differential of +1.18 per game.
#4 Dallas Stars
With an impressive 76.2% win percentage and a steady goal differential (+1.02), the Stars secured a home performance score of 93.28, proving Dallas is a tough place for visiting teams.
#5 Colorado Avalanche
The Avs maintained a solid 73.8% win rate at home, averaging +1.10 goals per game, earning them a home-zone score of 92.39.
Top Performing NHL Teams in Away Time Zones
Not every NHL team folds under pressure when they hit the road. Some thrive away from familiar comforts, excelling even when crossing multiple time zones.
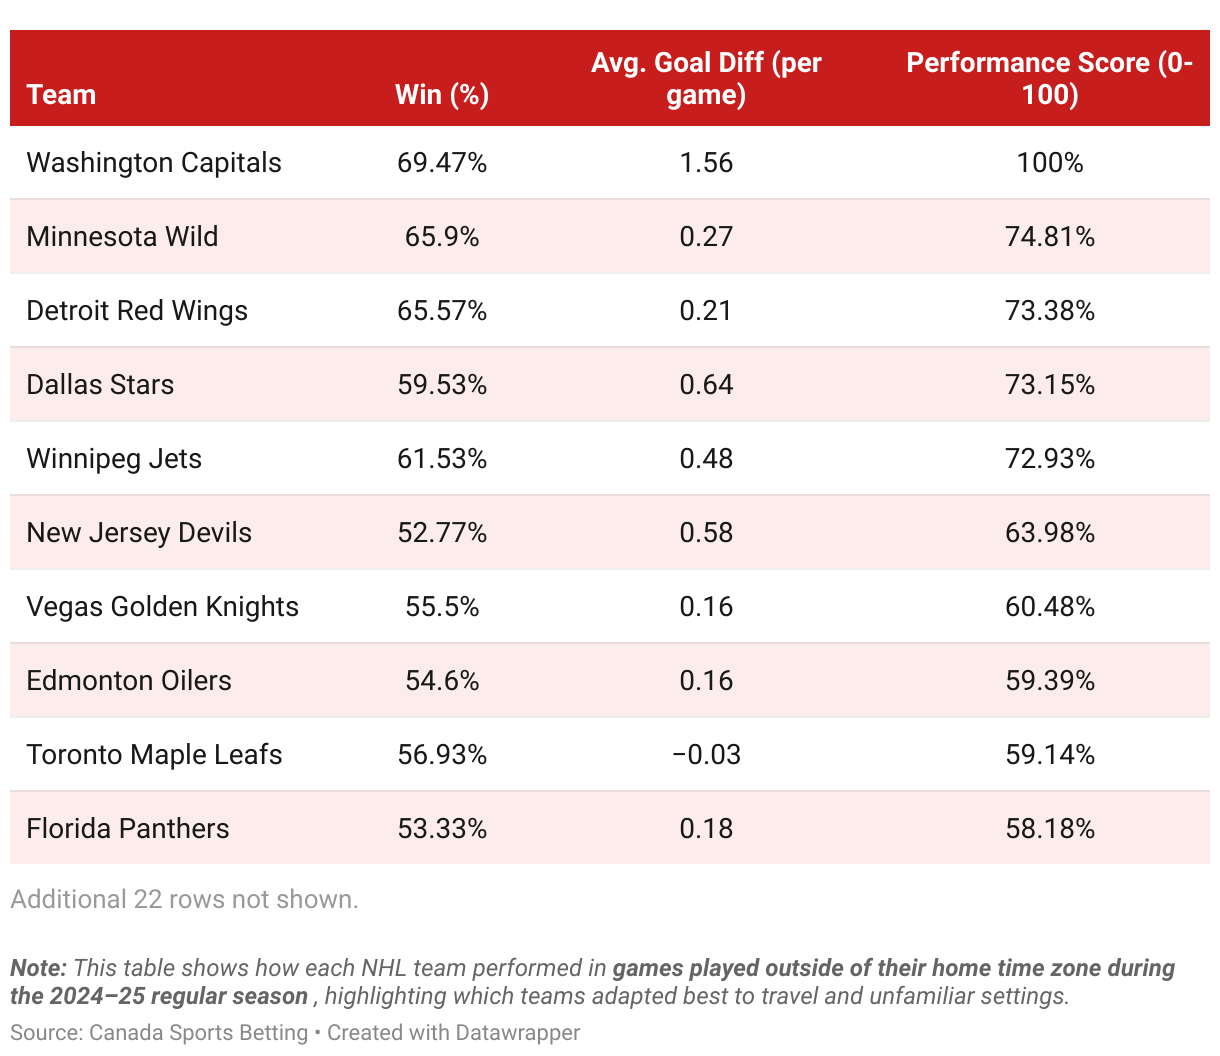
#1 Washington Capitals (The Ultimate Road Warrior)
The Caps led the league with a perfect away-zone performance score of 100.00, averaging a remarkable +1.56 goal differential alongside a strong 69.47% win percentage on the road.
#2 Minnesota Wild
With a solid 65.9% win rate away from their Central base, the Wild proved they can weather hostile crowds and unfamiliar clocks, finishing with a score of 74.81.
#3 Detroit Red Wings
Despite some struggles overall, Detroit thrived away from home, achieving an away-zone score of 73.38, driven by a respectable 65.57% win rate and a steady goal differential (+0.21).
#4 Dallas Stars
Dallas was consistently solid away from home, posting a 59.53% win percentage and an impressive average goal differential of +0.64, good for an overall score of 73.15.
#5 Winnipeg Jets
The Jets continued their high-level play away from Central time, earning a 72.93 performance score behind a 61.53% win rate and a strong +0.48 goal differential.
Top Performing NHL Teams in Eastern Time Zone Games
The Eastern Time Zone hosts a significant portion of NHL games. So, who stood out on the Eastern stage?
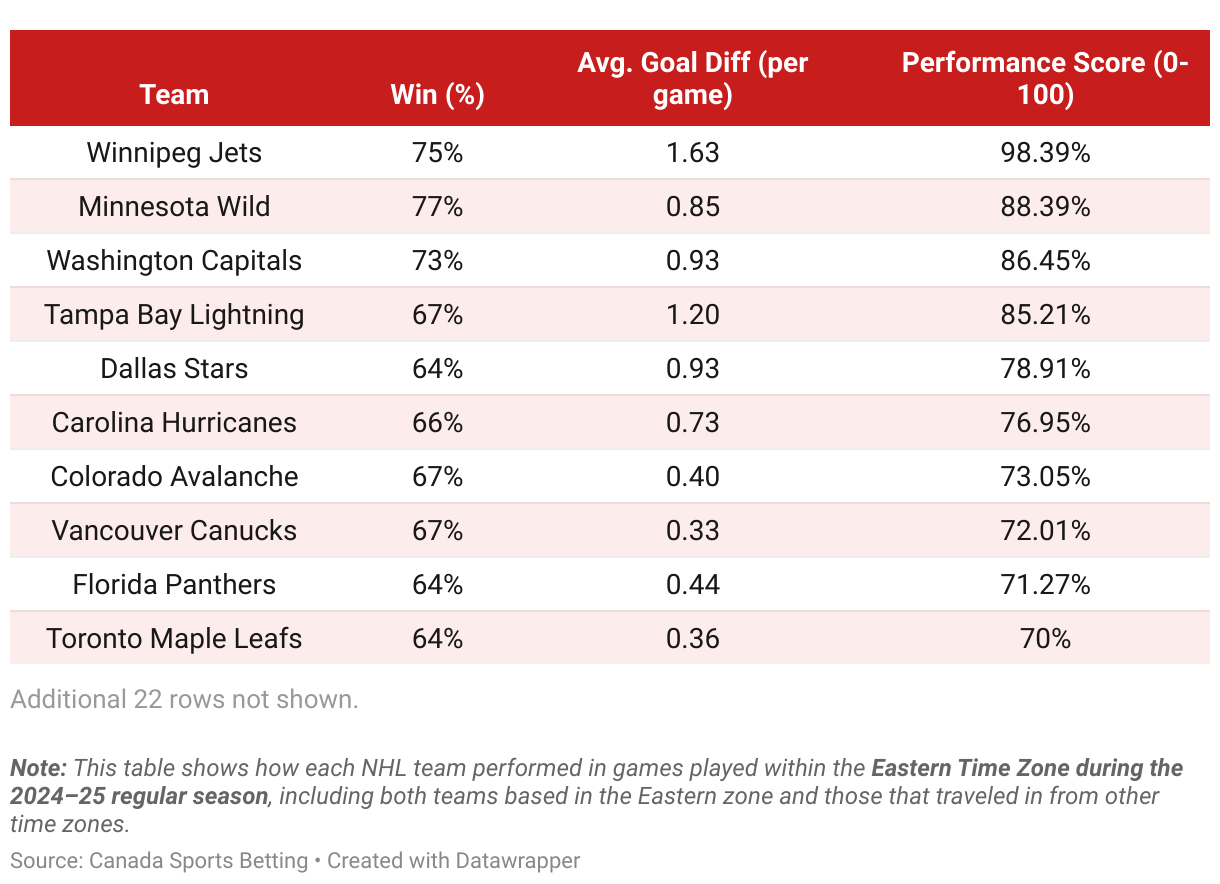
#1 Winnipeg Jets (Home Time Zone: Central)
The Jets adapted flawlessly, earning a top-tier score of 98.39, backed by their exceptional 75% win percentage and a dominant +1.63 goal differential.
#2 Minnesota Wild (Home Time Zone: Central)
Another Central standout, the Wild recorded the highest win percentage (77%) in Eastern matchups, finishing with a performance score of 88.39.
#3 Washington Capitals (Home Time Zone: Eastern)
At home in the East, the Caps delivered consistently with a 73% win percentage and a solid +0.93 goal differential, achieving a score of 86.45.
#4 Tampa Bay Lightning (Home Time Zone: Eastern)
The Lightning’s strong offense (+1.20 goal differential) and consistent 67% win rate netted them a performance score of 85.21.
#5 Dallas Stars (Home Time Zone: Central)
Dallas secured their Eastern visits with a reliable 64% win percentage and solid goal differential (+0.93), scoring 78.91 overall.
Top Performing NHL Teams in Central Time Zone Games
Central zone games are often pivotal on challenging road trips—here’s who handled the mid-country matchups best:
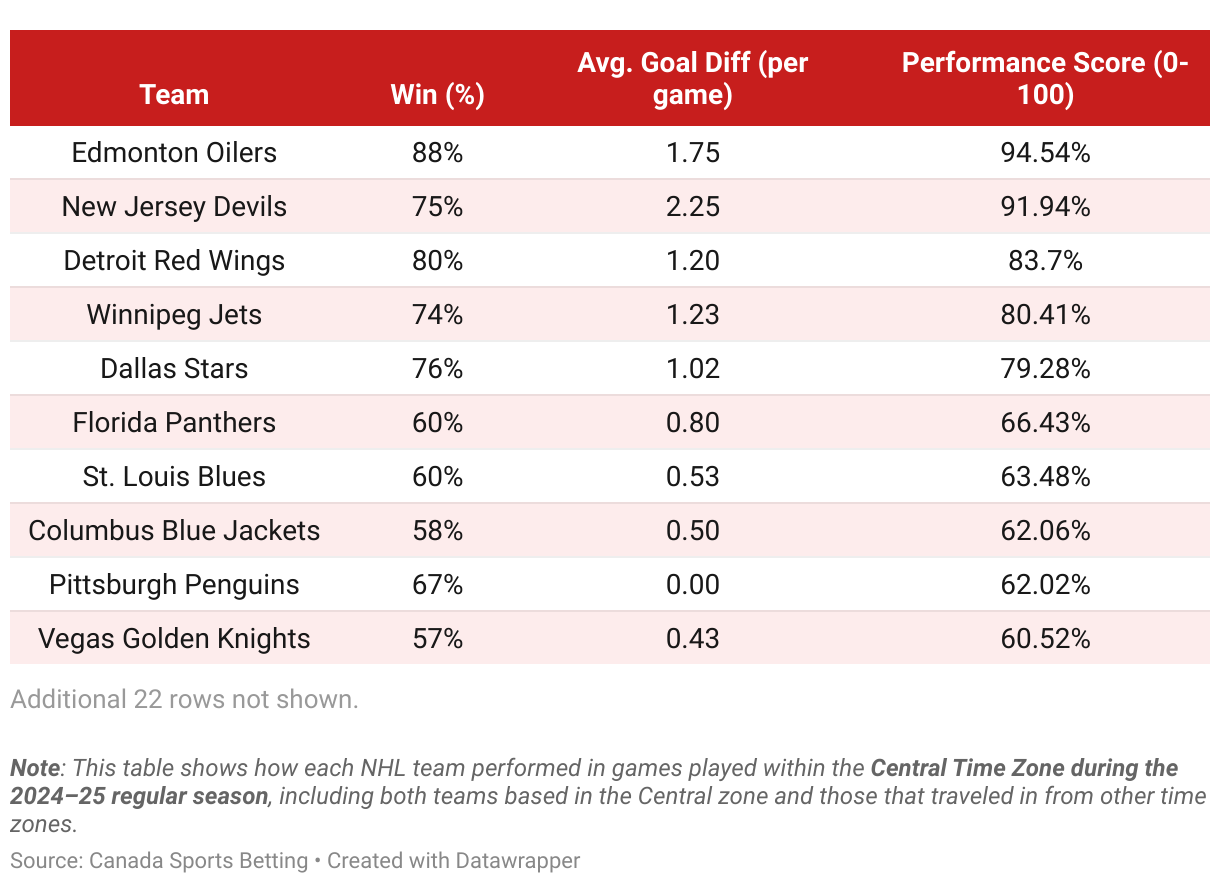
#1 Edmonton Oilers (Home Time Zone: Mountain)
The Edmonton Oilers conquered Central territory with a superb 88% win rate and outstanding goal differential (+1.75), scoring 94.54 overall.
#2 New Jersey Devils (Home Time Zone: Eastern)
Dominating offensively with the highest goal differential (+2.25) and a 75% win rate, the Devils achieved an impressive Central score of 91.94.
#3 Detroit Red Wings (Home Time Zone: Eastern)
Detroit performed strongly with an 80% win rate and a steady goal differential (+1.20), securing a score of 83.70.
#4 Winnipeg Jets (Home Time Zone: Central)
Reliable as ever, the Jets earned a 74% win rate, translating to a strong 80.41 score.
#5 Dallas Stars (Home Time Zone: Central)
Dallas’s consistency showed again with a 76% win rate and a solid +1.02 goal differential, earning 79.28 overall.
Top Performing NHL Teams in Mountain Time Zone Games
Traveling to the Mountain Time Zone can disrupt routines—but these teams adjusted better than most.

#1 Washington Capitals (Home Time Zone: Eastern)
The Caps achieved perfection in Mountain games—winning 100% of their matchups with an incredible +2.50 goal differential, earning a flawless 100 score.
#2 Colorado Avalanche (Home Time Zone: Mountain)
At home in the Mountain zone, the Avalanche maintained a strong 73.8% win rate and solid goal differential (+1.10), finishing with a score of 71.34.
#3 New York Islanders (Home Time Zone: Eastern)
Travel didn’t stop the Islanders, who delivered a 75% win rate and a +1.00 goal differential, landing a score of 70.83.
#4 Detroit Red Wings (Home Time Zone: Eastern)
Detroit again showed strength, posting a 75% win rate and a positive +0.75 goal differential, scoring 68.06 overall.
#5 Winnipeg Jets (Home Time Zone: Central)
Adapting well, the Jets earned a 66.7% win rate with a solid +0.67 goal differential, securing a performance score of 63.02.
Top Performing NHL Teams in Pacific Time Zone Games
Late nights, cross-country flights, and West Coast matchups challenge NHL teams—but these teams thrived under Pacific lights.

#1 Carolina Hurricanes (Home Time Zone: Eastern)
The East Coast Hurricanes topped the Pacific zone games with an 83.3% win percentage and robust +1.17 goal differential, posting an outstanding 95.88 performance score.
#2 Los Angeles Kings (Home Time Zone: Pacific)
The Kings defended home ice strongly, posting 78% wins and a +1.07 goal differential for a 90.65 score.
#3 Vegas Golden Knights (Home Time Zone: Pacific)
Vegas continued their Pacific zone excellence, winning 75% of games with a +1.18 goal differential, scoring 89.77.
#4 Washington Capitals (Home Time Zone: Eastern)
Impressive once again, the Capitals recorded 66.7% wins and an exceptional +1.50 goal differential for a solid 87.54 score.
#5 St. Louis Blues (Home Time Zone: Central)
The Blues surprised many, winning 81.3% of their Pacific matchups and maintaining a steady goal differential (+0.25), achieving 82.87 overall.
Are You Geared Up for the 2025–26 NHL Season?
Whether you’re backing your team into the 2025–26 season, weighing your bets on upcoming NHL matchups, or tracking momentum trends, this breakdown lays out who’s poised to stay hot—and which teams might cool off on the road.
Methodology
Canada Sports Betting analyzed over 1,300 NHL regular-season matchups from the 2024–25 season to evaluate how teams performed across different time zones. Each game was categorized based on whether it took place:
- Within a team’s home time zone
- Outside a team’s home time zone
- Or specifically in the Eastern, Central, Mountain, or Pacific time zones
Two core performance metrics were used to assess each team:
1. Win Percentage (WPCT)
This reflects how often a team won in each time zone, with partial credit awarded for overtime losses.
WPCT: Wins + 0.5 × OT Losses, divided by Total Games Played)
Where:
- Wins = Total number of wins in the time zone
- Overtime Losses = Games lost in overtime or shootout
- Total Games Played = Total games played in that time zone
2. Average Goal Differential per Game (AVG_DIFF)
This indicates a team’s average margin of victory or defeat in a specific time zone.
AVG_DIFF = OWN_GOALS_PER_GAME − OPP_GOALS_PER_GAME
Where:
OPP_GOALS_PER_GAME = Average number of goals the team allowed per game
OWN_GOALS_PER_GAME = Average number of goals the team scored per game
Both metrics were normalized to a 0–100 scale and combined to produce an Overall Performance Score (0–100) for each team in each time zone context. Only regular season games were included in this analysis.